
Jin-Fu Liang, Xue-You Wu, Yu An, Wei-Zhong Chen, Jun Wang. Computation and analysis of light emission in two-bubble sonoluminescence[J]. Chinese Physics B, 2020, 29(9):
- Chinese Physics B
- Vol. 29, Issue 9, (2020)
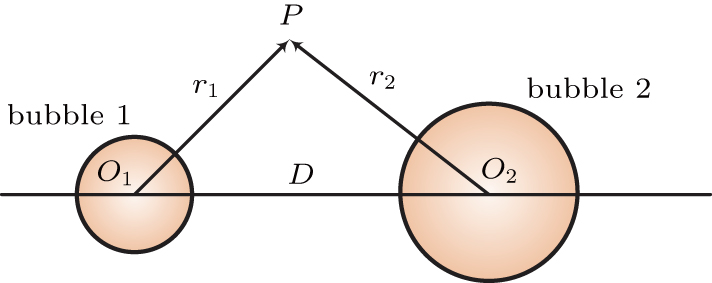
Fig. 1. Geometry of two interacting cavitation bubbles with different ambient radii.
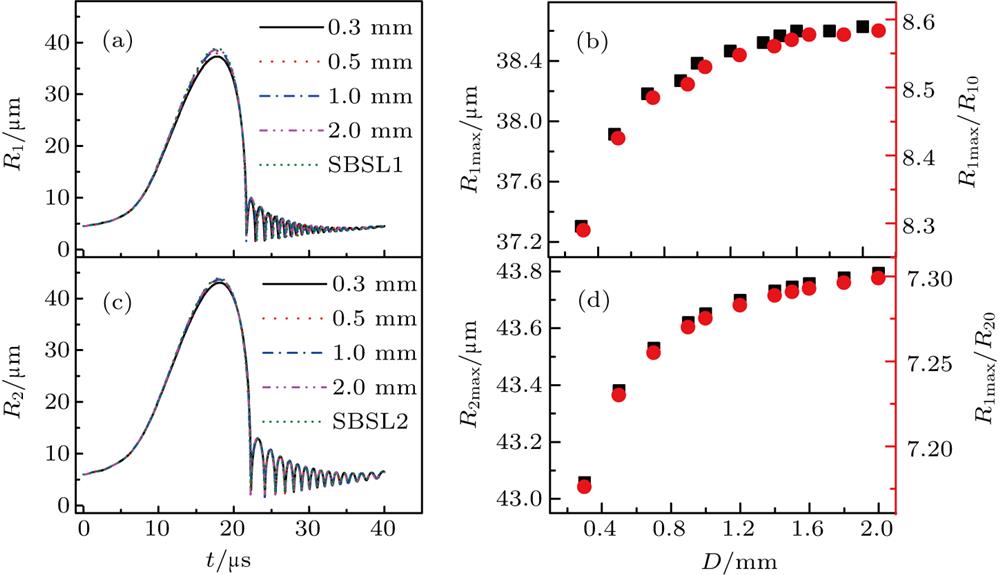
Fig. 2. (a) and (c) Radii of two argon bubbles as a function of time. The amplitude of the driving acoustic pressure is p a = 1.30 atm, and the cases of 0.3, 0.5, 1.0, and 2.0 mm denote the distance between two bubbles, D . The cases of SBSL denote single isolated bubbles without any effect from the other bubble. (b) and (d) Maximum radii of the two bubbles, and the ratios of the maximum and ambient radii as a function of distance D .
Fig. 3. Acoustic radiation pressures from other bubbles as a function of time: (a) bubble 1 with initial radius of 4.5 μm, (b) bubble 2 with initial radius of 6.0 μm. Here p a = 1.30 atm, and the cases of 0.3, 0.5, 1.0 and 2.0 mm denote different values of D , respectively.
Fig. 4. Bubble 1 with ambient radius of 4.5 μm at different distances D from the other bubble 2 with ambient radius 6.0 μm. (a) Energy spectra, (b) temperature when the bubble reaches its minimum size, and (c) corresponding pressure. Here p a = 1.30 atm and the cases of 0.3, 0.5, 0.8, 1.0, 1.5 and 2.0 mm denote different values of D , respectively. SBSL1 denotes the cases of single isolated bubbles with ambient radius of 4.5 μm without any effect from other bubbles.
Fig. 5. Bubble 2 with ambient radius of 6.0 μm at different distances D from the other bubble 1 with ambient radius 4.5 μm. (a) Energy spectra, (b) Temperature when the bubble reaches its minimum size, and (c) corresponding pressure. p a = 1.30 atm and the cases of 0.3, 0.5, 0.8, 1.0, 1.5 and 2.0 mm denote different values of D , respectively. SBSL2 denotes the cases of single isolate bubbles with initial radius of 6.0 μm without any effect from the other bubble.
Fig. 6. Simulation results for bubble 1 with an ambient radius of 4.5 μm at distance D = 0.3 mm from bubble 2 with an ambient radius of 6.0 μm. The amplitude of the driving pressure p a = 1.30 atm. (a) Radiation power of bubble 1 versus time, (b) energy spectra, (c) temperature, and (d) pressure.
Fig. 7. Simulation results for bubble 2 with an ambient radius of 6.0 μm at distance D = 0.3 mm from bubble 1 with an ambient radius of 4.5 μm. The amplitude of the driving pressure p a = 1.30 atm. (a) Radiation power of bubble 2 versus time, (b) energy spectra, (c) temperature, and (d) pressure.
Fig. 8. Simulation results of the degree of ionization (α ) inside two sonoluminescing bubbles at different D : (a) bubble 1 with an ambient radius of 4.5 μm, (b) bubble 2 with an ambient radius 6.0 μm.

Set citation alerts for the article
Please enter your email address
© Copyright 2018-2021 | Chinese Laser Press. All Rights Reserved 沪ICP备15018463号-20