
Jiaqiang Zhang, Min Zhang, Jinde Yin, Haifeng Lin, Peiguang Yan. Design of Low Loss Hollow-Core Anti-Resonance Fiber for 3 μm Spectral Region[J]. Laser & Optoelectronics Progress, 2021, 58(17): 1723001
- Laser & Optoelectronics Progress
- Vol. 58, Issue 17, 1723001 (2021)
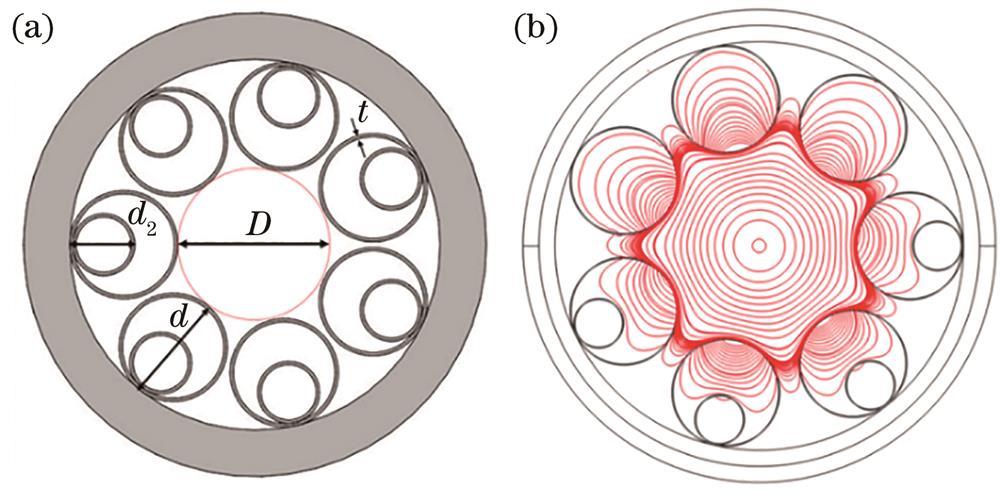
Fig. 1. Profile of optical fiber.(a) Structure of NANF; (b) simulation of electric field intensity contour
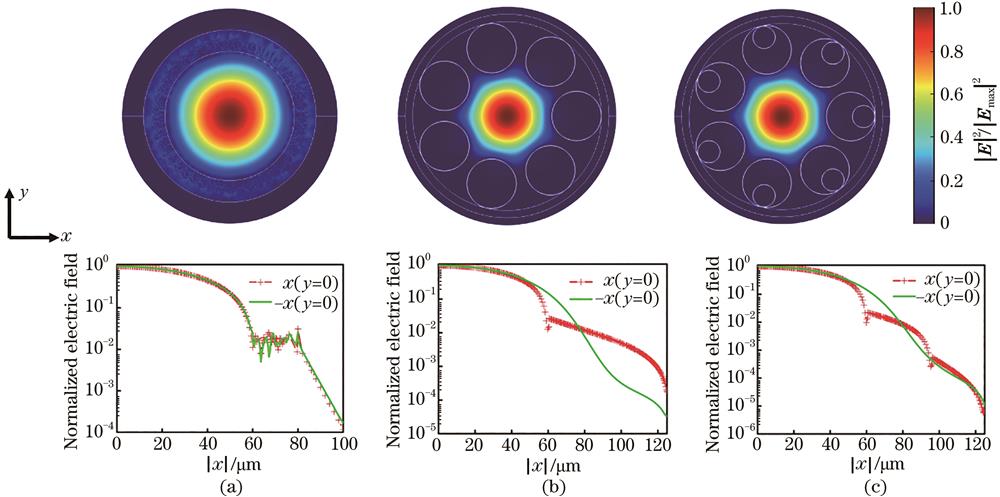
Fig. 2. Fundamental mode normalized electric field distributions and electric field variation curves along different directions of three types of optical fibers. (a) HCF; (b) ARF; (c) NANF
Fig. 3. Relationship between core fundamental mode loss and outer diameter of cladding capillary
Fig. 4. Relationship between fiber structure and normalized electric field intensity in tube gap.(a) Structure of HC-ARF; (b) inter-tube structure with g=-t; (c) relationship between normalized electric field intensity along solid line of Fig. (a) and d
Fig. 5. Relationship between core fundamental mode loss and core diameter
Fig. 6. Relationship between core fundamental mode loss and outer diameter of embedded casing
Fig. 7. Loss curves of two kinds of optical fibers and absorption curve of F300 type silica
Fig. 8. Performance curves of two polarization states of core fundamental mode and lowest loss higher order mode. (a) Relationship between real part of ffective refractive index and bending radius; (b) bending loss
Fig. 9. Electric field distribution at different bending radii. (a) 10 cm; (b) 19 cm
Fig. 10. Electric field distribution of HC-ARF and HC-NANF at different bending radii. (a) 15 cm; (b) 10 cm
Fig. 11. Relationship between total loss and material absorption of two kinds of fibers with different core diameters. (a) Wide range diagram; (b) enlarged view of dashed box of Fig. (a)

Set citation alerts for the article
Please enter your email address
© Copyright 2018-2021 | Chinese Laser Press. All Rights Reserved 沪ICP备15018463号-20