• Laser & Optoelectronics Progress
  • Vol. 59, Issue 12, 1215018 (2022)
Ruoyan Wei1、*, Siyuan Huo1, and Xiaoqing Zhu2
Author Affiliations
  • 1College of Information Technology, Hebei University of Economics and Business, Shijiazhuang 050061, Hebei , China
  • 2Faculty of Information Technology, Beijing University of Technology, Beijing 100124, China
  • show less
    DOI: 10.3788/LOP202259.1215018 Cite this Article Set citation alerts
    Ruoyan Wei, Siyuan Huo, Xiaoqing Zhu. Design and Implementation of Multimodel Estimation Algorithm for Nonrigid Matching Images[J]. Laser & Optoelectronics Progress, 2022, 59(12): 1215018 Copy Citation Text show less
    Image matching at distance ratio threshold of 0.8[27]. (a) 1m2; (b) 1m3; (c) 1m4; (d) 1m5
    Fig. 1. Image matching at distance ratio threshold of 0.8[27]. (a) 1m2; (b) 1m3; (c) 1m4; (d) 1m5
    Histograms of distance ratio of matching images. (a) 1m2; (b) 1m3; (c) 1m4; (d) 1m5
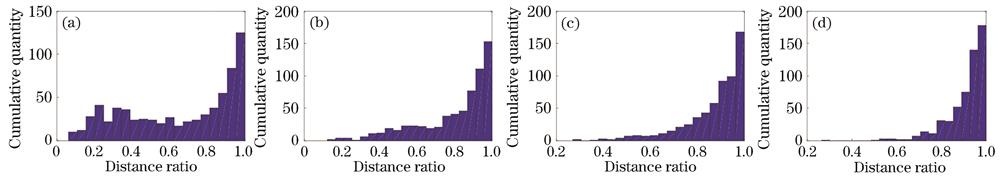
    Fig. 2. Histograms of distance ratio of matching images. (a) 1m2; (b) 1m3; (c) 1m4; (d) 1m5
    Distribution of inliers and outliers in the matched images with zoom change[28]. (a) Correct matched pairs; (b) distribution of inliers and outliers (red points are outliers, yellow points are inliers)
    Fig. 3. Distribution of inliers and outliers in the matched images with zoom change[28]. (a) Correct matched pairs; (b) distribution of inliers and outliers (red points are outliers, yellow points are inliers)
    Secondary removal of outliers[29]. (a) Matched pairs obtained by existing method; (b) vectors of position change between inliers, and the included outliers
    Fig. 4. Secondary removal of outliers[29]. (a) Matched pairs obtained by existing method; (b) vectors of position change between inliers, and the included outliers
    Flow chart of the proposed method
    Fig. 5. Flow chart of the proposed method
    Schematic of conscient distribution of neighbor points
    Fig. 6. Schematic of conscient distribution of neighbor points
    Algorithm of inlier ratio promotion based on near neighbor inlier distribution consensus
    Fig. 7. Algorithm of inlier ratio promotion based on near neighbor inlier distribution consensus
    Histograms of inlier distance errors. (a) Boston; (b) BruggeTower; (c) ExtremeZoom; (d) Graf; (e) Effel
    Fig. 8. Histograms of inlier distance errors. (a) Boston; (b) BruggeTower; (c) ExtremeZoom; (d) Graf; (e) Effel
    Multi-model estimation algorithm based on distance error marginalization
    Fig. 9. Multi-model estimation algorithm based on distance error marginalization
    Vector of position change between inliers. (a) Leafs[28]; (b) Toy and Bread[29]; (c) Booksh[28]; (d) ExtremeZoom[28]
    Fig. 10. Vector of position change between inliers. (a) Leafs[28]; (b) Toy and Bread[29]; (c) Booksh[28]; (d) ExtremeZoom[28]
    Schematic of image gridding and local area with its neighbor areas
    Fig. 11. Schematic of image gridding and local area with its neighbor areas
    Secondary removal algorithm of outlier
    Fig. 12. Secondary removal algorithm of outlier
    Experimental results on homogr dataset. (a) Inlier ratio of different image pairs; (b) inlier ratio after outlier filtering out; (c) recall of inliers; (d) original number of matched pairs; (e) number of matched pairs after outlier filtering out
    Fig. 13. Experimental results on homogr dataset. (a) Inlier ratio of different image pairs; (b) inlier ratio after outlier filtering out; (c) recall of inliers; (d) original number of matched pairs; (e) number of matched pairs after outlier filtering out
    Inlier distance error obtained by different methods
    Fig. 14. Inlier distance error obtained by different methods
    Comparison of average performance of different algorithms on different criteria. (a) Undetected outlier ratio; (b) number of inliers; (c) consumption time
    Fig. 15. Comparison of average performance of different algorithms on different criteria. (a) Undetected outlier ratio; (b) number of inliers; (c) consumption time
    Multi-plane estimation obtained by the proposed method under Adelaidermf data set. (a) ladysymon; (b) neem; (c) nese; (d) johnsona; (e) elderhallb; (f) unihouse; (g) bonhall; (h) napiera; (i) oldclassicswing; (j) library
    Fig. 16. Multi-plane estimation obtained by the proposed method under Adelaidermf data set. (a) ladysymon; (b) neem; (c) nese; (d) johnsona; (e) elderhallb; (f) unihouse; (g) bonhall; (h) napiera; (i) oldclassicswing; (j) library
    ParameterIndoorOutdoor
    Wash

    Scene

    0722

    Scene

    0758

    Scene

    0726

    Toys and BreadsGrafScared HeartSaint Peter’s BasilicaKremlinPotala
    Size/(pixel×pixel)768×5761296×9681296×9681296×968480×640800×6401065×693/1039×6871039×688/1032×771800×500/800×5411023×682/1400×808
    Number of correspondences81331972909930117212331292144017292280
    Table 1. Information of image pairs
    ImageIndicatorRANSACPROSACNAPSACP-NAPSACSC-RANSACAdalamOANETSuperGlueProposed method
    Washnoi14247173467416364
    nor532526033
    t /s0.630.1280.440.2160.2230.260.3210.1760.135

    Scene

    0722

    noi5841627107692123
    nor5412404821
    t /s0.570.970.2880.350.920.6710.770.610.56

    Scene

    0758

    noi759832585912195127
    nor4636716852
    t /s0.780.490.620.730.750.640.760.520.63

    Scene

    0726

    noi8631019161203847
    nor1131306020
    t /s0.930.1830.4190.2990.3140.3010.3510.2330.213
    Toys and Breadsnoi18918488142193451275439460
    nor2473515941
    t /s0.530.1650.420.360.390.430.4110.3080.253
    Grafnoi82872960436910483
    nor81351661331
    t /s0.620.210.3920.4110.430.370.4580.4190.352
    Scared Heartnoi157755185112205135185
    nor25581335543
    t /s0.610.2110.3560.4120.390.3830.4160.2940.314
    Saint Peter’s Basilicanoi7125357347105100116
    nor0956502032
    t /s0.710.2910.6520.4890.5210.4770.5030.3910.401
    Kremlinnoi8149284015574645
    nor087360781
    t /s0.710.3410.4820.5320.5910.520.5210.5870.512
    Potalanoi78612116765156
    nor224480811
    t /s0.80.2610.6110.5420.6650.6510.6390.5790.599
    Table 2. Comparison results
    ImageNumber of planesPEARLMulti-XMulti-HCONSACMCTSequential RANSACProposed
    ladysymon28.915.314.492.953.803.801.43
    neem34.210.000.002.7414.4414.441.88
    nese25.330.000.000.0012.830.470.83
    johnsona29.213.752.4714.4818.7728.043.7
    elderhallb510.336.455.3111.6920.3118.675.28
    unihouse59.916.397.218.8410.6910.692.99
    bonhall615.637.918.2216.9329.2920.438.19
    napiera311.993.123.442.7221.3211.662.53
    oldclassicswing26.110.000.001.6915.21.320.02
    library36.710.961.431.2114.7911.350.66
    Mean8.8343.3893.2576.32516.14412.092.72
    Average standard deviation2.562.572.485.335.026.651.83
    Table 3. Plane error rate of different methods
    Ruoyan Wei, Siyuan Huo, Xiaoqing Zhu. Design and Implementation of Multimodel Estimation Algorithm for Nonrigid Matching Images[J]. Laser & Optoelectronics Progress, 2022, 59(12): 1215018
    Download Citation