• Photonics Research
  • Vol. 11, Issue 12, 2054 (2023)
Farbod Riahi1, Alexander Bußmann2, Carlos Doñate-Buendia1, Stefan Adami2、3, Nicolaus A. Adams2、3, Stephan Barcikowski4, and Bilal Gökce1、4、*
Author Affiliations
  • 1Chair of Materials Science and Additive Manufacturing, School of Mechanical Engineering and Safety Engineering, University of Wuppertal, 42119 Wuppertal, Germany
  • 2Chair of Aerodynamics and Fluid Mechanics, School of Engineering and Design, Technical University of Munich, 85748 Garching bei München, Germany
  • 3Munich Institute of Integrated Materials, Energy, and Process Engineering (MEP), Technical University of Munich, 85748 Garching bei München, Germany
  • 4Technical Chemistry I and Center for Nanointegration Duisburg-Essen (CENIDE), University of Duisburg-Essen, 45141 Essen, Germany
  • show less
    DOI: 10.1364/PRJ.498204 Cite this Article Set citation alerts
    Farbod Riahi, Alexander Bußmann, Carlos Doñate-Buendia, Stefan Adami, Nicolaus A. Adams, Stephan Barcikowski, Bilal Gökce. Characterizing bubble interaction effects in synchronous-double-pulse laser ablation for enhanced nanoparticle synthesis[J]. Photonics Research, 2023, 11(12): 2054 Copy Citation Text show less
    (a) Synchronized bubble pairs are generated with the same pulse energy (Ep). Configuration to be examined with the process parameters ΔEp=0, Δx=Constant, Δt=0. (b) The size of the cavitation bubble depends on the material and the applied laser pulse energy. For independent analysis of double bubble dynamics, the relationship between the spatial pulse spacing and the maximum size of the cavitation bubble should be constant. Therefore, the maximum height of a single cavitation bubble (Hmax) induced by a defined laser pulse energy is used as a parameter for choosing the distance between two cavitation bubbles for each material. The spatial pulse spacings for this study correspond to approximately 0, 2, or 4 times Hmax for each material.
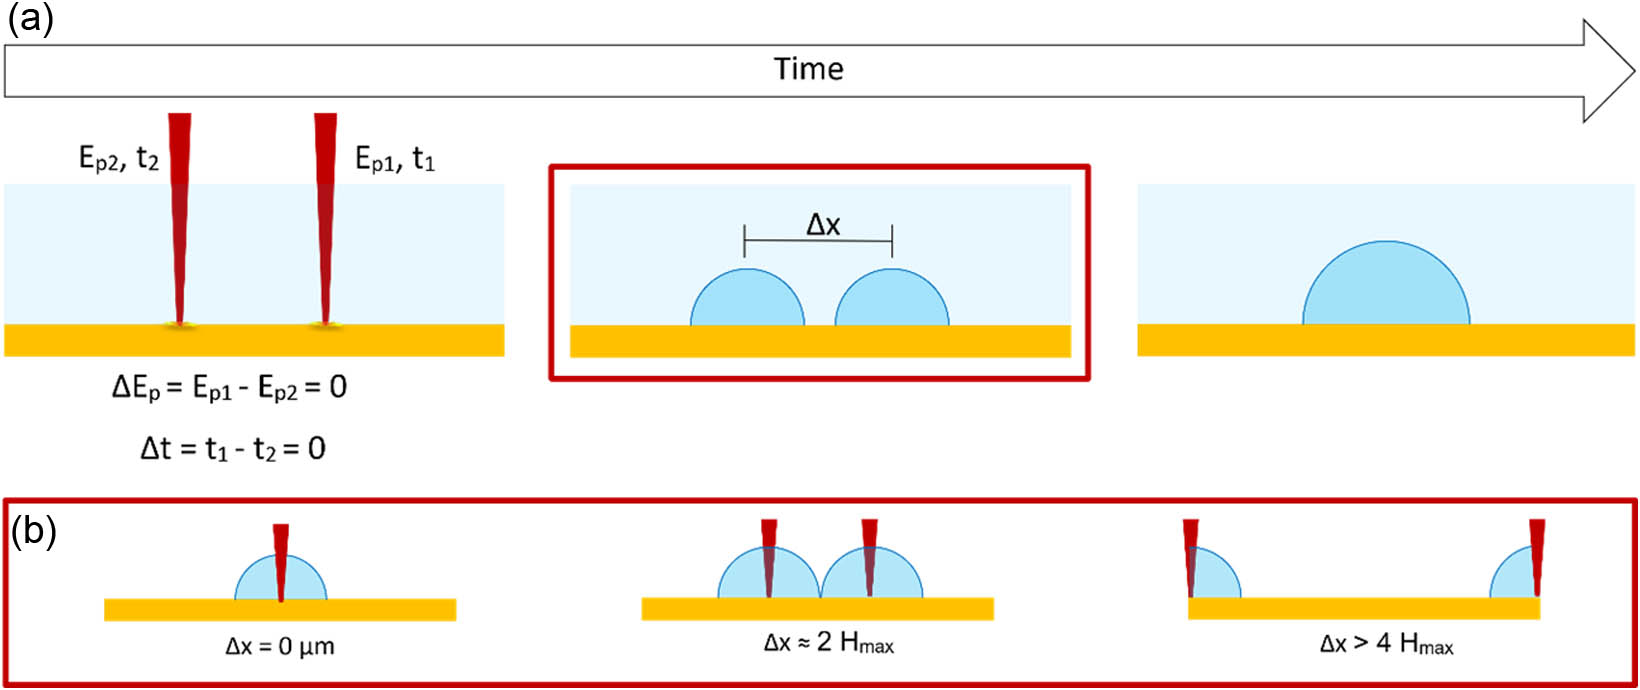
    Fig. 1. (a) Synchronized bubble pairs are generated with the same pulse energy (Ep). Configuration to be examined with the process parameters ΔEp=0, Δx=Constant, Δt=0. (b) The size of the cavitation bubble depends on the material and the applied laser pulse energy. For independent analysis of double bubble dynamics, the relationship between the spatial pulse spacing and the maximum size of the cavitation bubble should be constant. Therefore, the maximum height of a single cavitation bubble (Hmax) induced by a defined laser pulse energy is used as a parameter for choosing the distance between two cavitation bubbles for each material. The spatial pulse spacings for this study correspond to approximately 0, 2, or 4 times Hmax for each material.
    Schematic diagram of coaxial diffuse shadowgraphy system: (a) for top-view angle; (b) for side-view angle. By placing a dichroic mirror at 45° in front of the glass cell, picosecond laser pulses can pass through, ablate the YAG target, and generate cavitation bubbles. The mirror also reflects the visible flashlight into the camera lens, capturing shadowgraph images from the top-view. (c) Schematic of the side- and top-view imaging geometry and related two-dimensional shadowgraph projections.
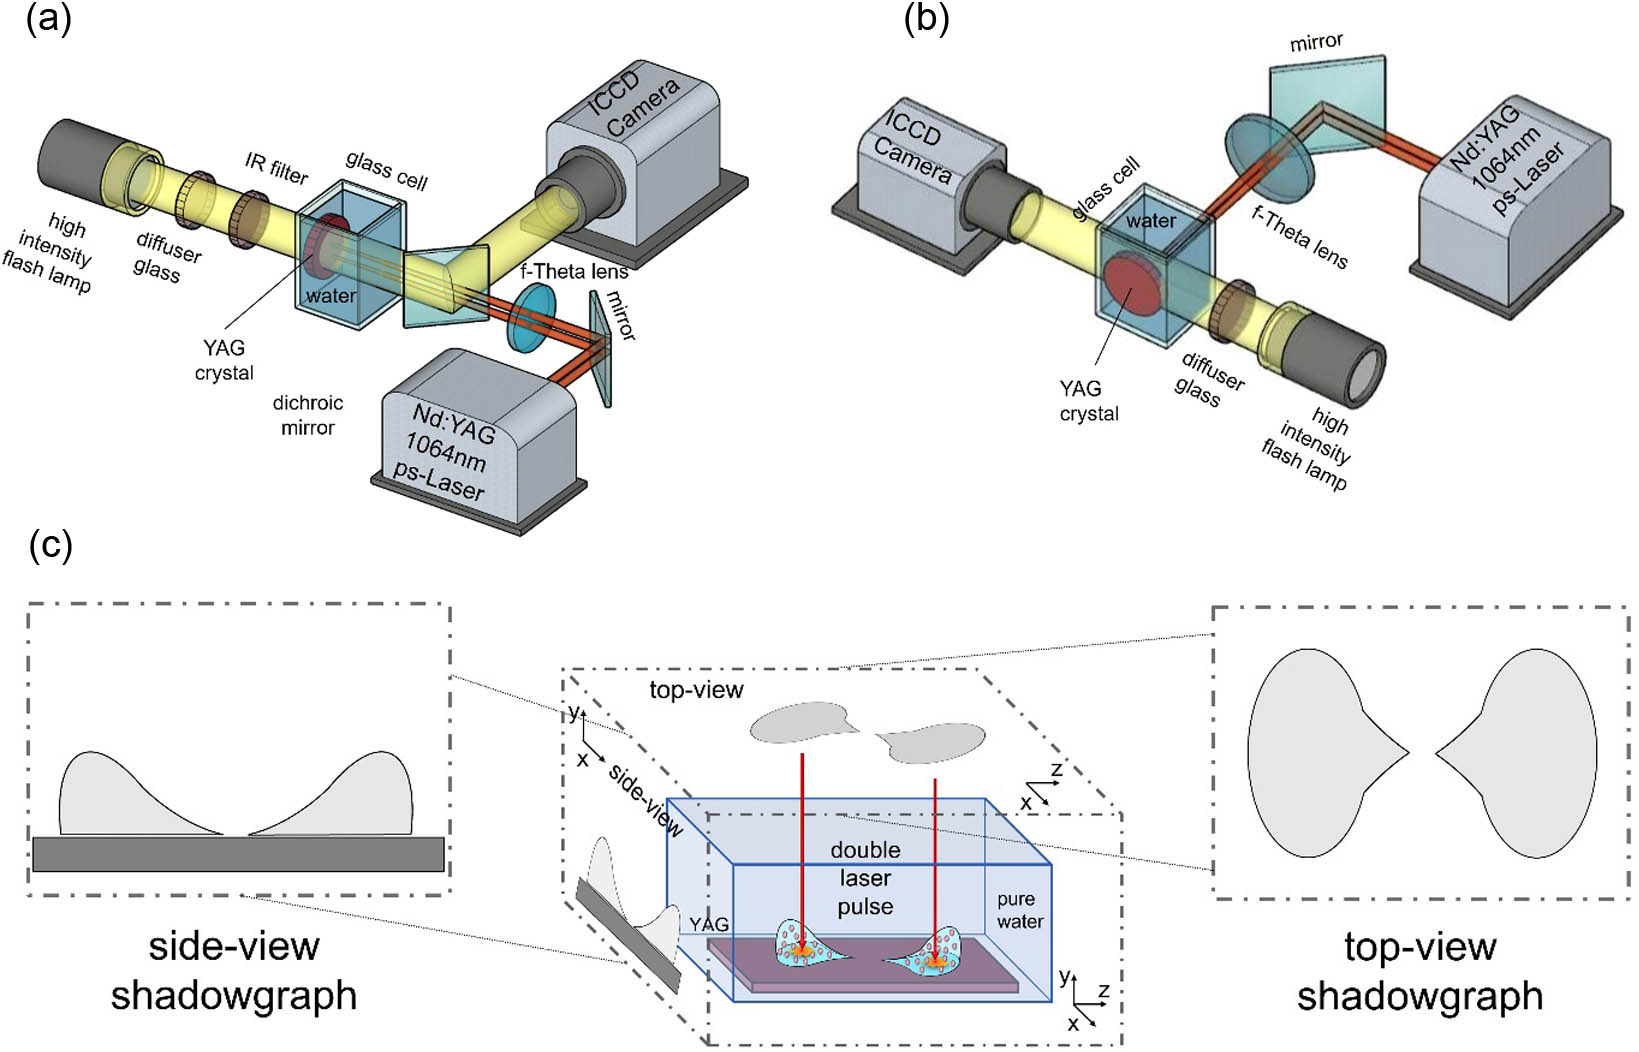
    Fig. 2. Schematic diagram of coaxial diffuse shadowgraphy system: (a) for top-view angle; (b) for side-view angle. By placing a dichroic mirror at 45° in front of the glass cell, picosecond laser pulses can pass through, ablate the YAG target, and generate cavitation bubbles. The mirror also reflects the visible flashlight into the camera lens, capturing shadowgraph images from the top-view. (c) Schematic of the side- and top-view imaging geometry and related two-dimensional shadowgraph projections.
    Particle size analysis of Au nanoparticles synthesized for Δx=0, 600, and 1400 μm. (a) Hydrodynamic mass-weighted particle diameter distributions measured by analytical disk centrifuge for Au nanoparticles. (b) Mean peak diameter value analyzed by Tukey’s least significance difference (LSD) test based on ADC measurements. Probability of F-test (p<0.0001). (c) The number-weighted primary particle diameter distributions for Au were obtained from particle size analysis of ≈1000 particles from the STEM images for varied Δx. (d)–(f) HAADF-STEM images of Au nanoparticles synthesized for Δx=0, 600, and 1400 μm inter-pulse distances. The scale bar is the same for all images.
    Fig. 3. Particle size analysis of Au nanoparticles synthesized for Δx=0, 600, and 1400 μm. (a) Hydrodynamic mass-weighted particle diameter distributions measured by analytical disk centrifuge for Au nanoparticles. (b) Mean peak diameter value analyzed by Tukey’s least significance difference (LSD) test based on ADC measurements. Probability of F-test (p<0.0001). (c) The number-weighted primary particle diameter distributions for Au were obtained from particle size analysis of 1000 particles from the STEM images for varied Δx. (d)–(f) HAADF-STEM images of Au nanoparticles synthesized for Δx=0, 600, and 1400 μm inter-pulse distances. The scale bar is the same for all images.
    (a) Number-weighted primary particle diameter distributions for YAG obtained from particle size analysis of ≈1000 particles from the STEM images for several Δx. (b)–(d) STEM images of YAG nanoparticles synthesized at Δx=0, 460, and 1075 μm inter-pulse distances. Scale bar is the same for all images.
    Fig. 4. (a) Number-weighted primary particle diameter distributions for YAG obtained from particle size analysis of 1000 particles from the STEM images for several Δx. (b)–(d) STEM images of YAG nanoparticles synthesized at Δx=0, 460, and 1075 μm inter-pulse distances. Scale bar is the same for all images.
    Shadowgraph imaging to exhibit the temporal evolution of cavitation bubble dynamics generated at Δx=0, 460, and 1075 μm inter-pulse distances, and visualize the interaction of the two simultaneously generated cavitation bubbles produced with the same pulse energy (470 μJ for each cavitation bubble) on the YAG crystal surface from (a) top-view and (b) side-view. The 1000 μm scale bar is the same for all image series in (a) and (b). Magnifications of the bubble pair images at 2Hmax, 38 μs shortly before their collapse are highlighted.
    Fig. 5. Shadowgraph imaging to exhibit the temporal evolution of cavitation bubble dynamics generated at Δx=0, 460, and 1075 μm inter-pulse distances, and visualize the interaction of the two simultaneously generated cavitation bubbles produced with the same pulse energy (470 μJ for each cavitation bubble) on the YAG crystal surface from (a) top-view and (b) side-view. The 1000 μm scale bar is the same for all image series in (a) and (b). Magnifications of the bubble pair images at 2Hmax, 38 μs shortly before their collapse are highlighted.
    Cavitation bubble volume evolution during PLAL of YAG at different spatial bubble pair distances. Expansion and shrinkage phase for a single cavitation bubble for Δx=0 μm and one of the bubbles for Δx=460 and 1075 μm.
    Fig. 6. Cavitation bubble volume evolution during PLAL of YAG at different spatial bubble pair distances. Expansion and shrinkage phase for a single cavitation bubble for Δx=0  μm and one of the bubbles for Δx=460 and 1075 μm.
    Comparison of the cavitation bubble dynamics between experiments (top row for each Δx) and simulations (bottom row for each Δx). Only for the single bubble evolution Δx=0 μm, wall effects are included in the simulations.
    Fig. 7. Comparison of the cavitation bubble dynamics between experiments (top row for each Δx) and simulations (bottom row for each Δx). Only for the single bubble evolution Δx=0  μm, wall effects are included in the simulations.
    Contours of the non-dimensional velocity magnitude for the wall-directed and inter-bubble jet regimes. Time instances are given in the upper left corner of each frame, and the black arrows indicate the direction of the velocity. The direction of the jets is indicated with a white arrow. (a) Formation of a wall-directed jet of single cavitation bubble collapsing at a wall with Δx=0 μm. The wall is placed at the lower edge of each image. (b) Inter-bubble jet formation for a bubble pair with Δx=460 μm. (c) Inter-bubble jet formation for a bubble pair with Δx=1075 μm. For Δx=460 μm and Δx=1075 μm, only one of the bubbles is visualized, where the second bubble lies on the left. A wall is omitted due to the employed reduced axisymmetric space.
    Fig. 8. Contours of the non-dimensional velocity magnitude for the wall-directed and inter-bubble jet regimes. Time instances are given in the upper left corner of each frame, and the black arrows indicate the direction of the velocity. The direction of the jets is indicated with a white arrow. (a) Formation of a wall-directed jet of single cavitation bubble collapsing at a wall with Δx=0  μm. The wall is placed at the lower edge of each image. (b) Inter-bubble jet formation for a bubble pair with Δx=460  μm. (c) Inter-bubble jet formation for a bubble pair with Δx=1075  μm. For Δx=460  μm and Δx=1075  μm, only one of the bubbles is visualized, where the second bubble lies on the left. A wall is omitted due to the employed reduced axisymmetric space.
    (a) Impact of bubble-height-normalized lateral inter-pulse distance of synchronized bubble pairs on YAG and Au nanoparticle diameters. Particle size analysis using STEM (primary particle diameter Xc, N≈1000) and analytical disk centrifuge (hydrodynamic diameter). (b) YAG bubble pair experiments at Δx=460 μm; center to center inter-bubble distance (IBD) measurements (left Y axis) are plotted as well as attraction velocity of the individual bubbles toward each other (right Y axis) with the maximum bubble expansion time (tmax−exp) referred to as reference bubble lifetime events.
    Fig. 9. (a) Impact of bubble-height-normalized lateral inter-pulse distance of synchronized bubble pairs on YAG and Au nanoparticle diameters. Particle size analysis using STEM (primary particle diameter Xc, N1000) and analytical disk centrifuge (hydrodynamic diameter). (b) YAG bubble pair experiments at Δx=460  μm; center to center inter-bubble distance (IBD) measurements (left Y axis) are plotted as well as attraction velocity of the individual bubbles toward each other (right Y axis) with the maximum bubble expansion time (tmaxexp) referred to as reference bubble lifetime events.
    PLAL setup with the batch chamber was controlled by extending the temporal delay between laser pulses beyond the lifetime of the cavitation bubbles with a digital delay generator. In this way, the nanoparticles will not be affected by undesirable cavitation bubble interactions with the next laser pulse.
    Fig. 10. PLAL setup with the batch chamber was controlled by extending the temporal delay between laser pulses beyond the lifetime of the cavitation bubbles with a digital delay generator. In this way, the nanoparticles will not be affected by undesirable cavitation bubble interactions with the next laser pulse.
    Observation of cavitation bubble evolution on the surface of Au target after a single pulse PLAL (Δx=0 μm).
    Fig. 11. Observation of cavitation bubble evolution on the surface of Au target after a single pulse PLAL (Δx=0  μm).
    Cavitation bubble height at maximum expansion on Au surface with a delay time of 20 μs, depending on the number of applied pulses at the same spot to examine the nanoparticle (NP) shielding effect and the change in the target surface.
    Fig. 12. Cavitation bubble height at maximum expansion on Au surface with a delay time of 20 μs, depending on the number of applied pulses at the same spot to examine the nanoparticle (NP) shielding effect and the change in the target surface.
    Mass-weighted particle size analysis of Au nanoparticles synthesized at Δx=0,600, and 1400 μm using an analytical ultracentrifuge for smaller Au nanoparticles below 7 nm, at 30,000 r/min.
    Fig. 13. Mass-weighted particle size analysis of Au nanoparticles synthesized at Δx=0,600, and 1400 μm using an analytical ultracentrifuge for smaller Au nanoparticles below 7 nm, at 30,000 r/min.
    Tukey’s least significance difference (LSD) test, results of statistical analysis of variance (ANOVA). Red squares indicate the significant difference in mean size values between two denoted lateral distances. Probability of F-test (p<0.0001).
    Fig. 14. Tukey’s least significance difference (LSD) test, results of statistical analysis of variance (ANOVA). Red squares indicate the significant difference in mean size values between two denoted lateral distances. Probability of F-test (p<0.0001).
    Each shadowgraph viewpoint reveals two-dimensional parameters: top view bubble half-width (a) and vertical bubble radius (b); side-view bubble half-width (a’) and bubble height (h)—a and a’ are the same parameter (bubble half-width) from two view angles.
    Fig. 15. Each shadowgraph viewpoint reveals two-dimensional parameters: top view bubble half-width (a) and vertical bubble radius (b); side-view bubble half-width (a’) and bubble height (h)—a and a’ are the same parameter (bubble half-width) from two view angles.
    Cavitation bubble three-dimensional radius evolution as a function of time, based on YAG shadowgraph imaging. Each shadowgraph viewpoint reveals two-dimensional parameters: top-view (t.v.) bubble horizontal radius (a) and bubble vertical radius (b); side-view (s.v.) bubble half-width (a’) and bubble height (h) for Δx equivalent to 0, 460, and 1075 μm. a and a’ are the same parameter (bubble half-width) from the two view angles, which used a similarity indicator for the shadowgraphy experiments from two angles.
    Fig. 16. Cavitation bubble three-dimensional radius evolution as a function of time, based on YAG shadowgraph imaging. Each shadowgraph viewpoint reveals two-dimensional parameters: top-view (t.v.) bubble horizontal radius (a) and bubble vertical radius (b); side-view (s.v.) bubble half-width (a’) and bubble height (h) for Δx equivalent to 0, 460, and 1075 μm. a and a’ are the same parameter (bubble half-width) from the two view angles, which used a similarity indicator for the shadowgraphy experiments from two angles.
    Center-to-center inter bubble distance (IBD) measurements based on YAG double pulse experiments at Δx=460 and 1075 μm (left Y axis) are plotted as well as attraction velocity toward induced cavitation bubbles (right Y axis). All cavitation bubbles collapsed at 40 μs at both Δx=460 and 1075 μm. Unlike pair bubbles at Δx=460 μm, which collide and collapse together, the more distant double cavitation bubbles at Δx=1075 μm, despite the presence of slight attraction phenomena, collapse departed far away from each other.
    Fig. 17. Center-to-center inter bubble distance (IBD) measurements based on YAG double pulse experiments at Δx=460 and 1075 μm (left Y axis) are plotted as well as attraction velocity toward induced cavitation bubbles (right Y axis). All cavitation bubbles collapsed at 40 μs at both Δx=460 and 1075 μm. Unlike pair bubbles at Δx=460  μm, which collide and collapse together, the more distant double cavitation bubbles at Δx=1075  μm, despite the presence of slight attraction phenomena, collapse departed far away from each other.
    Farbod Riahi, Alexander Bußmann, Carlos Doñate-Buendia, Stefan Adami, Nicolaus A. Adams, Stephan Barcikowski, Bilal Gökce. Characterizing bubble interaction effects in synchronous-double-pulse laser ablation for enhanced nanoparticle synthesis[J]. Photonics Research, 2023, 11(12): 2054
    Download Citation