
Jincheng Wen, Lin Zhang, Han Wu, Meng Li, Xiuquan Ma. Molecular Dynamics Simulation of Aluminum-Fused Silica Interface Shot by Femtosecond Laser[J]. Laser & Optoelectronics Progress, 2023, 60(1): 0114011
- Laser & Optoelectronics Progress
- Vol. 60, Issue 1, 0114011 (2023)
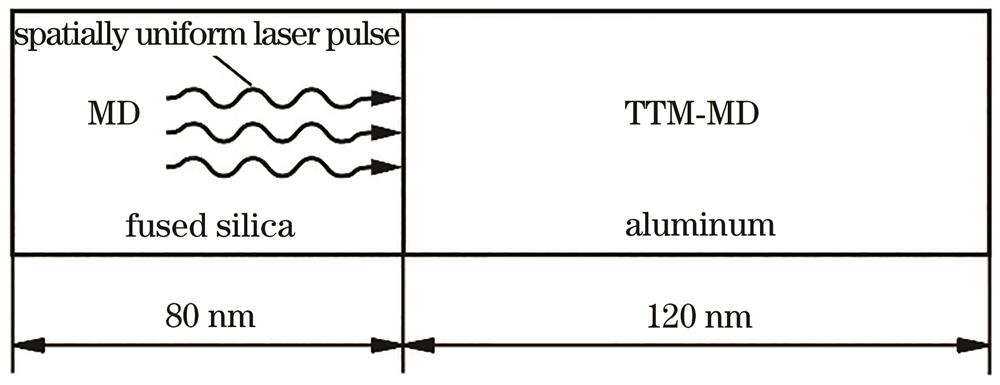
Fig. 1. Schematic of the fused silica-Al molecular dynamics welding simulation
![Snapshot of wetting simulation at different time after the aluminum is moved towards the fused silica (Drawn by VMD[33]). (a) 2 ps; (b) 10 ps; (c) 20 ps; (d) 30 ps; (e) 100 ps; (f) 200 ps](/richHtml/lop/2023/60/1/0114011/img_02.jpg)
Fig. 2. Snapshot of wetting simulation at different time after the aluminum is moved towards the fused silica (Drawn by VMD[33]). (a) 2 ps; (b) 10 ps; (c) 20 ps; (d) 30 ps; (e) 100 ps; (f) 200 ps
Fig. 3. PE change during the wetting process. (a) PE change for different ε values during 0.07-0.12 eV; (b) ΔPE following the change of ε
Fig. 4. Wetting area variation during the wetting process. (a) Wetting area variation during wetting simulations for different ε; (b) wetting area following the change of ε
Fig. 5. Fitting result of the work of adhesion
Fig. 6. Snapshots of the aluminum-silica glass welding process simulated by molecular dynamics
Fig. 7. Temperature and stress distribution of the system. (a) Temperature profile of the system at different time; (b) normal stress profile in the y-z plane of the system at different time
Fig. 8. Geometric parameters of the mixed region over time. (a) Length of the mixed region over time; (b) central position of the mixed region over time
Fig. 9. Thermodynamic property contours in the mixed region. (a) Temperature contour plot of aluminum atoms; (b) temperature contour plot of fused silica; (c) stress contour plot of aluminum atoms; (d) stress contour plot of fused silica
| ||||||||||||||||||||||||||||||||||||||||||||||||
Table 1. Statistics of melting temperature Tm and elastic constant C11 with respect to different LJ parameters σ @ ε=0.200 eV and ε @ σ=0.280 nm

Set citation alerts for the article
Please enter your email address
© Copyright 2018-2021 | Chinese Laser Press. All Rights Reserved 沪ICP备15018463号-20