
Nicolas Barré, Ravi Shivaraman, Simon Moser, Patrick Salter, Michael Schmidt, Martin J. Booth, Alexander Jesacher. Direct laser-written aperiodic photonic volume elements for complex light shaping with high efficiency: inverse design and fabrication[J]. Advanced Photonics Nexus, 2023, 2(3): 036006
- Advanced Photonics Nexus
- Vol. 2, Issue 3, 036006 (2023)
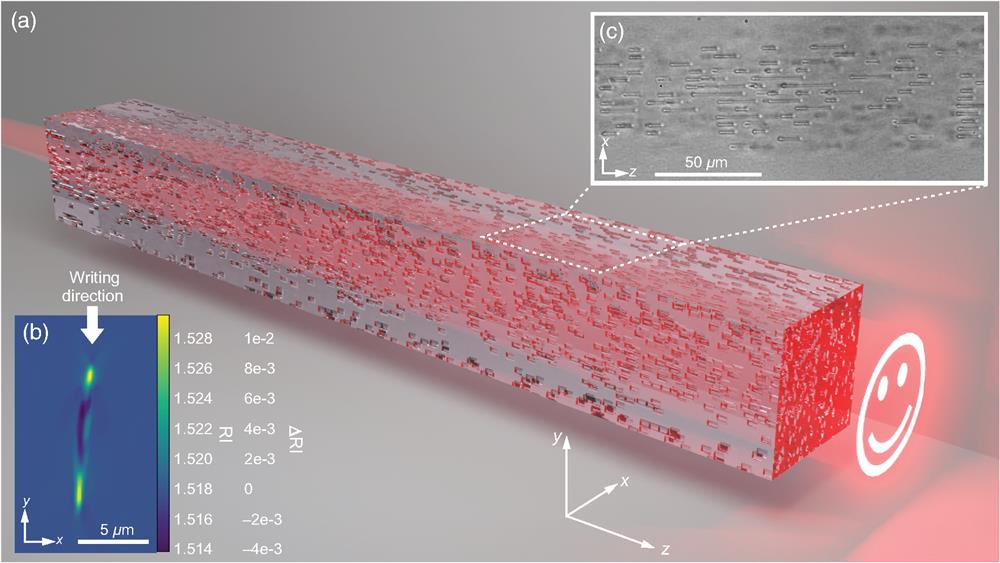
Fig. 1. Light manipulation with an APVE. (a) Sketch of a laser-processed glass substrate containing many voxels of modified RI. (b) Tomographically measured RI cross section of a single voxel. (c) Wide-field image taken from a fabricated device.
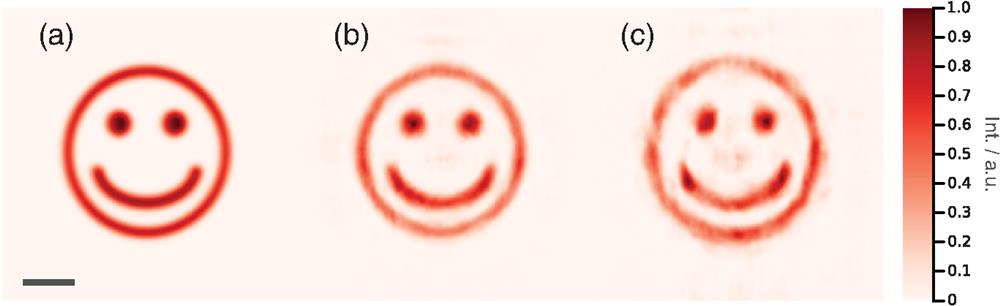
Fig. 2. Results from a smiley generator. (a) Designed output intensity; (b) simulated readout; (c) experimental result. The total light efficiency
Fig. 3. Wavelength multiplexing. Different parts of the smiley appear, depending on the readout wavelength. (a) Target intensity patterns used for the APVE design. (b) Results from a simulated readout. (c) Experimental readouts.
Fig. 4. Power conversion efficiencies of the multicolor APVE. The solid curves indicate the measured percentage of the output power transformed into the features mouth, eyes, and head, depending on the readout wavelength. The dashed lines correspond to simulated readouts.
Fig. 5. Principle of mode-division multiplexing with our mode sorter. Multiple signals are delivered via single-mode fibers, arranged in a triangle. A lens gives each input beam a specific AOI. The APVE transforms each input beam into one of six different HG modes.
Fig. 6. Simulated results from the mode sorter. The images show intensities (top row) and phases when reading out the APVE with a Gaussian beam (
Fig. 7. Experimental results from the mode sorter. The images show intensities (top row) and phases when reading out the APVE with a Gaussian beam (
Fig. 8. Evolution of the transmission
|
Table 1. (a) Simulated and (b) experimentally obtained conversion efficiencies η
|
Table 2. Simulated and experimentally measured transmission factors T
|
Table 3. Simulated efficiency values η i , j
|
Table 4. Experimental efficiency values η i , j
|
Table 5. Simulated and experimental transmission values T

Set citation alerts for the article
Please enter your email address
© Copyright 2018-2021 | Chinese Laser Press. All Rights Reserved 沪ICP备15018463号-20