Author Affiliations
1State Key Laboratory of Earth Surface Processes and Resource Ecology/MEM&MoE Key Laboratory of Environmental Change and Natural Hazards, Faculty of Geographical Science, Beijing Normal University, Beijing 100875, China2Key Laboratory of Land Surface Pattern and Simulation, Institute of Geographic Sciences and Natural Resources Research, CAS, Beijing 100101, China3College of Resources and Environment, University of Chinese Academy of Sciences, Beijing 100049, Chinashow less
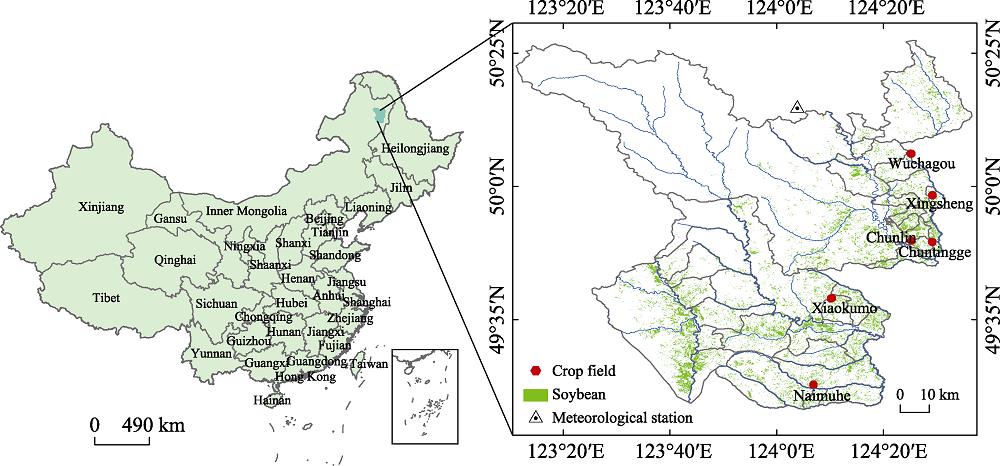
Fig. 1. Overview of the study area
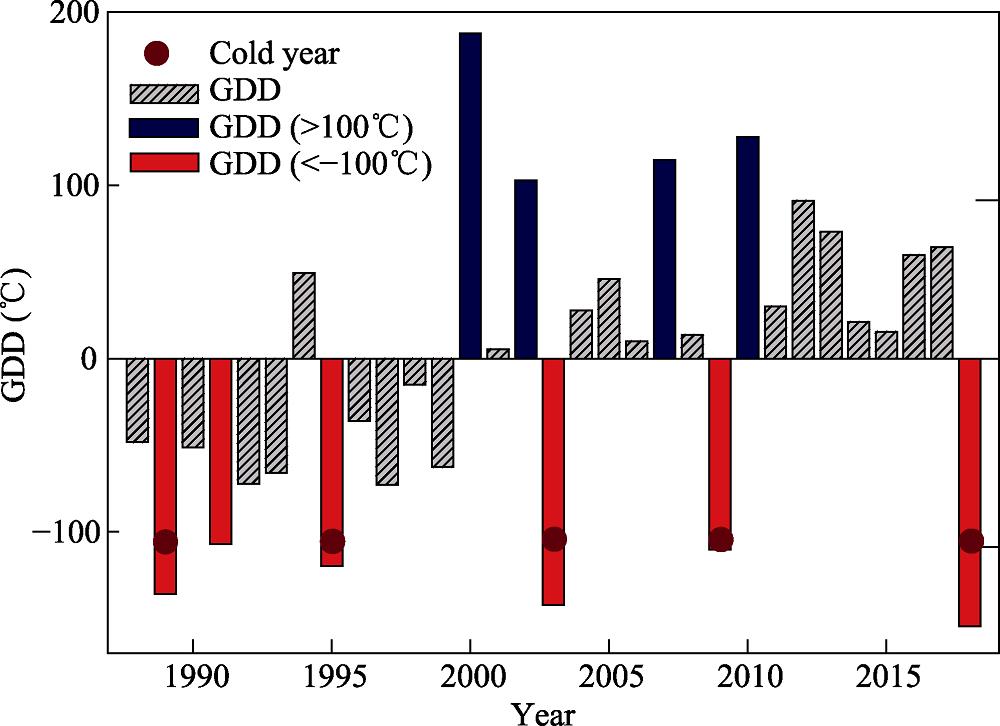
Fig. 2. The cold years in Northeast China
Fig. 3. Comparison between simulated and observed variables of soybean
Fig. 4. illustrates the simulated profiles of soybean LAIs determined from 512 simulations. The LAI values vary considerably from 2 to 7, which is largely due to the fact that soybean growth processes are variable under different weather conditions and farming management systems. Note that the early and late windows (denoted by shaded rectangles in the figure) basically cover the critical growth period of each simulation. These simulation results thus show a broad range of variability in training the regression model given in Eq. (1).
Fig. 5. The coefficient of determination (R2) for the regression models
Fig. 5. Daily leaf area index outputs from 512 simulations of the CROPGRO-Soybean model (the shaded rectangles indicate the “early-season” and “late-season” windows used for image observations)
Fig. 6. The maximum LAI and its specific observation dates of early and late growing season windows obtained from Sentinel-2 in 2018 (a and c represent the maximum LAI and its specific observation dates of early growing season windows; b and d for late growing season windows, respectively)
Fig. 7. Estimated yields by calibrated CROPGRO-Soybean model under different cold injury scenarios (scenarios S1, S2 and S3 are set as reducing 3℃, 2℃ and 1℃ at the whole growth stages, respectively. Scenario N4 is set as actual weather. Scenarios S5, S6, S7 and S8 are set randomly as minimum temperature of 0℃ for 5 consecutive days during the periods from seedling emergence to flowering stage, flowering stage to pod bearing stage, and pod bearing stage to filling stage, and filling stage to maturity stage, respectively.)
Fig. 8. The comparison between actual and simulated yield losses
Fig. 9. Spatial distribution of estimated yields in normal year (2017) and cold year (2018)
Fig. 10. The spatial distribution of yield losses in 2018 relative to 2017
| Year | Crop field | Wuchagou | Xingsheng | Chuntinge | Chunlin | Naimuhe | Xiaokumo |
|---|
| 2014 | Sowing date | 16 May. | 18 May. | 1 May. | 18 May. | 28 May. | 11 May. | | Flowering date | 14 Jul. | 12 Jul. | 30 Jun. | 6 Jul. | 18 Jul. | 30 Jul. | | Maturity date | 26 Sept. | 28 Sept. | 18 Sept. | 28 Sept. | 28 Sept. | 24 Sept. | | Plant density (plants/m2) | 39.69 | 30.42 | 47.73 | 36.75 | 37.98 | 38.47 | | Yield(kg/ha) | 1160 | 1350 | 1650 | 1150 | 610 | 1050 | | 2015 | Sowing date | 16 May. | 16 May. | 28 May. | 8 May. | 17 May. | 18 May. | | Flowering date | 16 Jul. | 10 Jul. | 2 Jul. | 12 Jul. | 16 Jul. | 8 Jul. | | Maturity date | 16 Sept. | 14 Sept. | 28 Sept. | 28 Sept. | 28 Sept. | 8 Sept. | | Plant density (plants/m2) | 47.94 | 35.6 | 38.18 | 26.24 | 25.84 | 28.58 | | Yield(kg/ha) | 980 | 1100 | 1410 | 1030 | 510 | 860 | | 2016 | Sowing date | 6 Jun. | 16 May. | 6 May. | 22 May. | 18 May. | 18 May. | | Flowering date | 20 Jul. | 14 Jul. | 28 Jul. | 28 Jul. | 2 Jul. | 2 Jul. | | Maturity date | 30 Sept. | 26 Sept. | 18 Sept. | 30 Sept. | 18 Sept. | 14 Sept. | | Plant density (plants/m2) | 32.97 | 30.55 | 40.04 | 42.9 | 40.8 | 35.82 | | Yield(kg/ha) | 1280 | 1450 | 1850 | 1370 | 670 | 1110 | | 2017 | Sowing date | 24 May. | 23 May. | 21 May. | 18 May. | 24 May. | 2 Jun. | | Flowering date | 8 Jul. | 12 Jul. | 22 Jul. | 8 Jul. | 1 Jul. | 14 Jul. | | Maturity date | 28 Sept. | 24 Sept. | 22 Sept. | 18 Sept. | 18 Sept. | 24 Sept. | | Plant density (plants/m2) | 43.5 | 35.76 | 27.56 | 36.9 | 40.6 | 52.36 | | Yield(kg/ha) | 1350 | 1500 | 1240 | 1500 | 750 | 1200 |
|
Table 1. The observation information of key growth period, planting density and yield of crop fields
| Crop field | Wuchagou | Xingsheng | Chuntinge | Chunlin | Naimuhe | Xiaokumo |
|---|
| Longitude (°) | 124.42 | 124.49 | 124.49 | 124.42 | 124.11 | 124.17 | | Latitude (°) | 50.10 | 49.97 | 49.83 | 49.83 | 49.4 | 49.7 | | Elevation (m) | 486 | 393 | 380 | 365 | 381 | 447 | | Cultivar | Heihe 38 | Heilong 35 | Hefeng 50 | Hefeng 25 | Hefeng 39 | Heihe 18 | | Maturity | Medium | Medium | Medium | Mid-late | Medium | Medium | | Cultivation way | Drilling | Drilling | Drilling | Ridge tillage | Drilling | Drilling |
|
Table 2. The basic information of six crop fields
| Coefficient | Definition | Default value | Wuchagou | Xingsheng | Chuntinge | Chunlin | Naimuhe | Xiaokumo |
|---|
| CSDL | Critical short day length below which reproductive development progresses with no day length effects (h) | 12.15 | 14.03 | 12.23 | 13.06 | 14.58 | 11.9 | 14.03 | | PPSEN | Slope of the relative response of development to photoperiod with time (1/h) | 0.2 | 0.235 | 0.294 | 0.287 | 0.229 | 0.146 | 0.304 | | EM-FL | Time between plant emergence and flower appearance (day) | 21 | 13.09 | 18.33 | 15.46 | 16.53 | 26.14 | 22.74 | | FL-SH | Time between first flower and first pod (day) | 6 | 6 | 6 | 6 | 6 | 6 | 6 | | FL-SD | Time between first flower and first seed (day) | 12 | 19.82 | 21.06 | 18.42 | 18.39 | 11.26 | 12.06 | | SD-PM | Time between first seed and physiological maturity (day) | 26 | 37.56 | 24.5 | 36.63 | 31.27 | 22.25 | 34.33 | | FL-LF | Time between first flower and end of leaf expansion (day) | 20 | 20 | 20 | 20 | 20 | 20 | 20 | | LFMAX | Maximum leaf photosynthesis rate at 30℃, 350 vpm CO2, and high light (mg CO2/m2 s) | 1.03 | 1.023 | 1.052 | 1.034 | 1.011 | 1.196 | 1.257 | | SLAVR | Specific leaf area of cultivar under standard growth conditions (cm2/g) | 385 | 311.2 | 303.8 | 301 | 317.6 | 337.9 | 301.1 | | SIZLF | Maximum size of full leaf (three leaflets (cm2) | 137 | 138.1 | 145.1 | 138 | 141.2 | 188.5 | 217.6 | | XFRT | Maximum fraction of daily growth that is partitioned to seed+shell (-) | 1 | 1 | 1 | 1 | 1 | 1 | 1 | | WTPSD | Maximum weight per seed (g) | 0.155 | 0.162 | 0.157 | 0.161 | 0.181 | 0.195 | 0.186 | | SFDUR | Seed filling duration for pod cohort at standard growth conditions (day) | 22 | 25.42 | 24.88 | 24.22 | 25.36 | 21.62 | 21.94 | | SDPDV | Average seed per pod under standard growing conditions (numbers per pod) | 2.2 | 2.415 | 2.276 | 2.09 | 2.24 | 2.397 | 1.794 | | PODUR | Time required for cultivar to reach final pod load under optimal conditions (day) | 13 | 13 | 13 | 13 | 13 | 13 | 13 |
|
Table 3. CROPGRO-Soybean model parameters and the genetic coefficients of crop fields
| Town | Yield loss (%) | Town | Yield loss (%) | Town | Yield loss (%) |
|---|
| Karichu | 21.23 | Wobei | 29.77 | Xiangyang | 24.35 | | Lingnan | 14.64 | Zhaxi | 19.54 | Wuerqi | 31.14 | | Neerkeqi | 22.61 | Wuchagou | 15.86 | Chaoyangliehu | 21.19 | | Qingsonggou | 24.52 | Naimuhe | 25.15 | Shiliudongfang | 32.28 | | Tuanjie | 19.38 | Maweishan | 18.34 | Nuominghe | 6.54 | | Yuchang | 8.76 | Kuweidi | 22.58 | Xiaoerhong | 18.08 | | Xinxing | 9.55 | Yuejing | 28.83 | Longtou | 29.25 | | Oukenhe | 18.24 | Kuilehe | 5.29 | Xinfeng | 20.63 | | Xingsheng | 28.04 | Dongsheng | 21.52 | Woluohe | 30.79 | | Ershili | -29.94 | Xiaokumo | 17.63 | Tiedong | 30.05 | | Wulubutie | 9.53 | Doushigou | 21.30 | Dakumo | 21.58 | | Hongqi | 22.65 | Chaoyanggou | 22.67 | Ergenghe | 7.97 | | Maanshan | 18.52 | Xinfa | 26.92 | Dongsheng | 21.52 | | Chunlin | 26.02 | Chuntinge | 16.09 | Maojiapu | 18.77 |
|
Table 4. The estimated yield losses of soybean at town level