
Fernando Brandi, Leonida Antonio Gizzi. Optical diagnostics for density measurement in high-quality laser-plasma electron accelerators[J]. High Power Laser Science and Engineering, 2019, 7(2): 02000e26
- High Power Laser Science and Engineering
- Vol. 7, Issue 2, 02000e26 (2019)
![Upper panel: interferogram of a pulsed gas jet in vacuum with a rectangular orifice acquired by means of a Nomarski interferometer; lower panel: corresponding average density map obtained with a phase-retrieval algorithm[22].](/richHtml/hpl/2019/7/2/02000e26/img_1.gif)
Fig. 1. Upper panel: interferogram of a pulsed gas jet in vacuum with a rectangular orifice acquired by means of a Nomarski interferometer; lower panel: corresponding average density map obtained with a phase-retrieval algorithm[22].
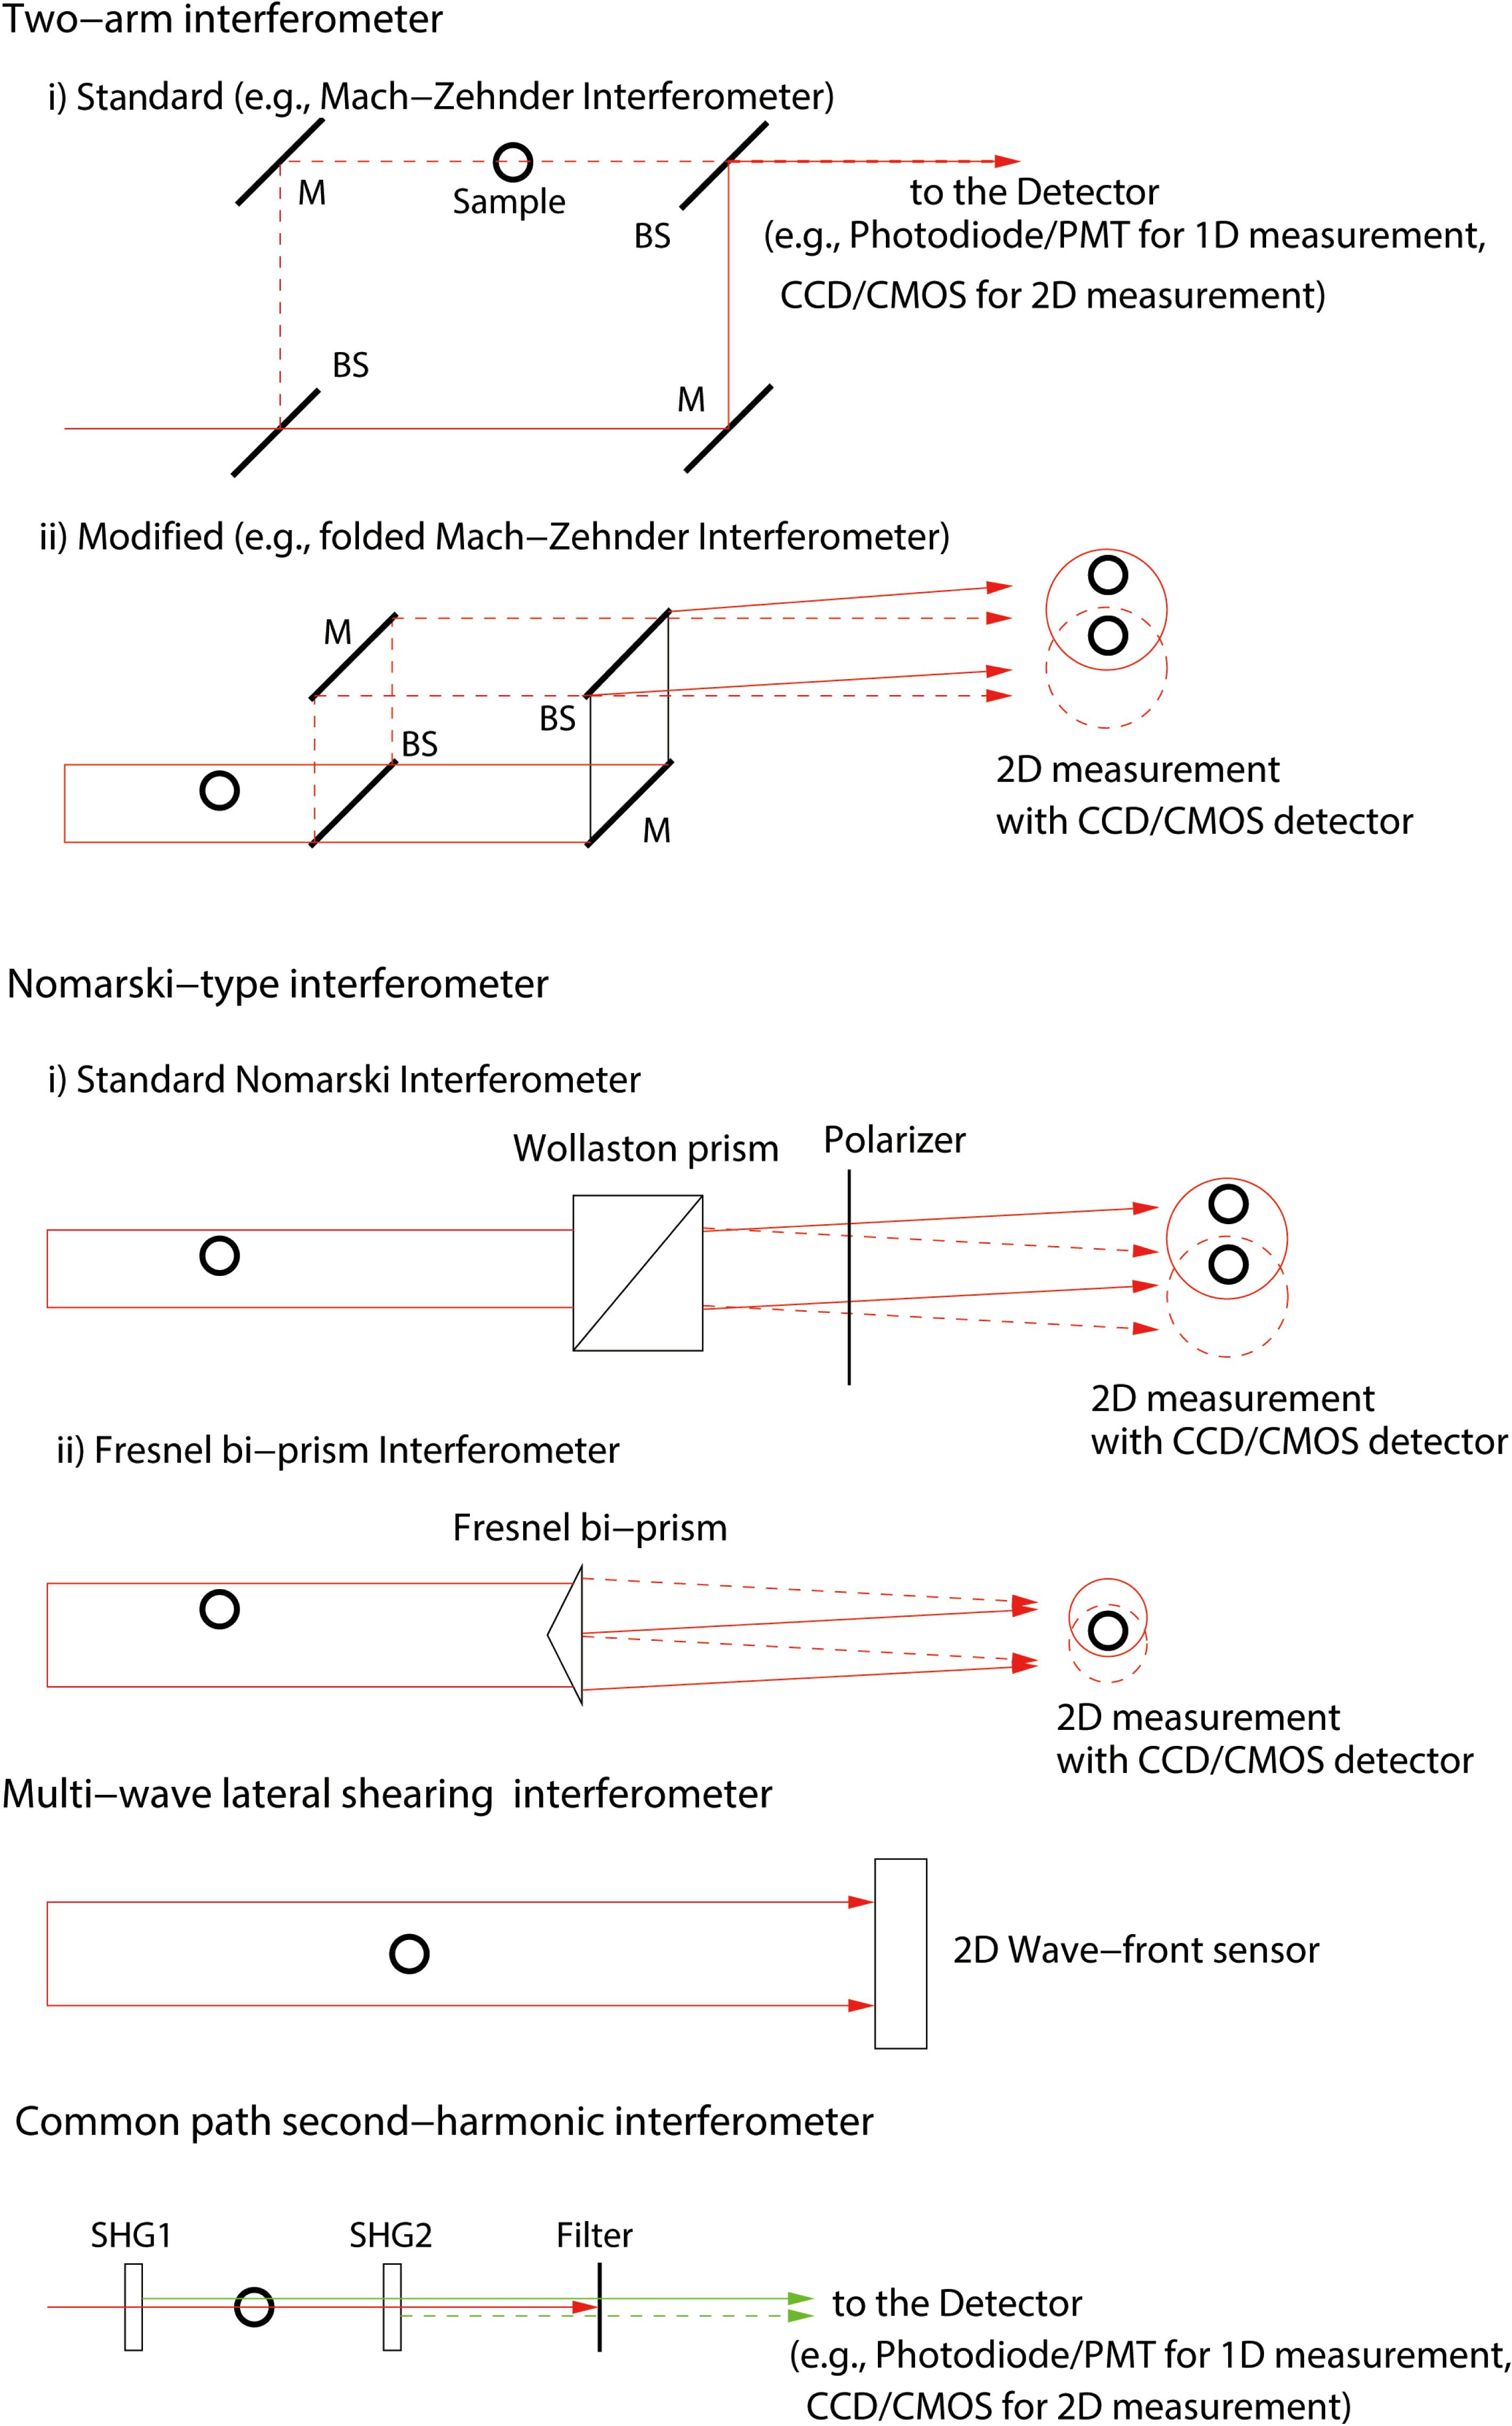
Fig. 2. Schematic representation of the most common interferometers used for density measurements in laser-plasma accelerators; M, mirror; BS, beam splitter; SHG, second-harmonic generation unit. Optical elements used for imaging, such as lenses, are omitted for clarity.
Fig. 3. Real-time measurements of the Ar gas number density inside a pulsed gas flow cell by an SHI at 1064 nm: black curve, pulse length 100 ms; red curve, pulse length 500 ms. Backing Ar pressure 600 mbar.
Fig. 4. Interferometric capability for neutral hydrogen density measurements. For each methodology considered, the wavelength used and the measured phase are shown. For SHI, the fundamental wavelength used is reported, while the phase shift refers to the actually detected second-harmonic wavelength, i.e., 400 nm. The solid lines correspond to the smallest measurable phase, indicated in the legend, while the dashed lines correspond to measurements within half-fringe.
Fig. 5. Interferometric capability for free-electron density measurements. For each methodology considered the wavelength used and the measured phase are shown. For SHI, the fundamental wavelength used is reported, while the phase shift refers to the actually detected second-harmonic wavelength, i.e., 400 nm. The solid lines correspond to the smallest measurable phase, indicated in the legend, while the dashed lines correspond to measurements within half-fringe, except for group delay measurements with the SHI.
Fig. 6. Schematic of the Stark broadening measurement setup, showing both longitudinal and transverse configurations.
Fig. 7. Schematic of the Raman scattering measurement setup, showing both backward and forward configurations. M, mirror, Mh, mirror with a hole in the center to let the electron beam through.
|
Table 1. Expected phase shifts in TAIs and SHIs for both hydrogen gas and free electrons at 800 nm and 400 nm wavelengths, with $L$ $n_{g}$ $10^{19}~\text{cm}^{-3}$ $n_{e}$ $10^{17}~\text{cm}^{-3}$
|
Table 2. Qualitative comparison of interferometric methods.

Set citation alerts for the article
Please enter your email address
© Copyright 2018-2021 | Chinese Laser Press. All Rights Reserved 沪ICP备15018463号-20