• Laser & Optoelectronics Progress
  • Vol. 59, Issue 10, 1015005 (2022)
Zhaofeng Huang1, Yunchao Tang2、*, Xiangjun Zou1、**, Mingyou Chen1, Hao Zhou1, and Tianlong Zou3
Author Affiliations
  • 1Collage of Engineering, South China Agriculture University, Guangzhou 510642, Guangdong , China
  • 2College of Urban and Rural Construction, Zhongkai University of Agriculture and Engineering, Guangzhou 510006, Guangdong , China
  • 3Foshan -Zhongke Innovation Research Institute of Intelligent Agriculture and Robotics, Foshan528200, Guangdong , China
  • show less
    DOI: 10.3788/LOP202259.1015005 Cite this Article Set citation alerts
    Zhaofeng Huang, Yunchao Tang, Xiangjun Zou, Mingyou Chen, Hao Zhou, Tianlong Zou. Visual Measurement of Crack Width Based on Backbone's Two-Scale Fusion of Features[J]. Laser & Optoelectronics Progress, 2022, 59(10): 1015005 Copy Citation Text show less
    Flowchart of the proposed method
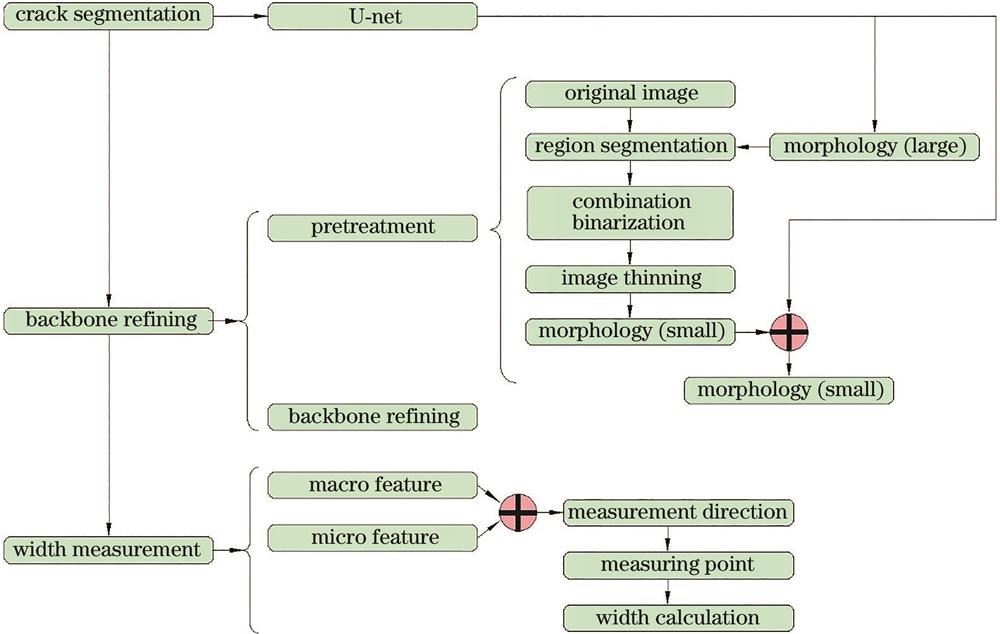
    Fig. 1. Flowchart of the proposed method
    Crack segmentation results of U-net
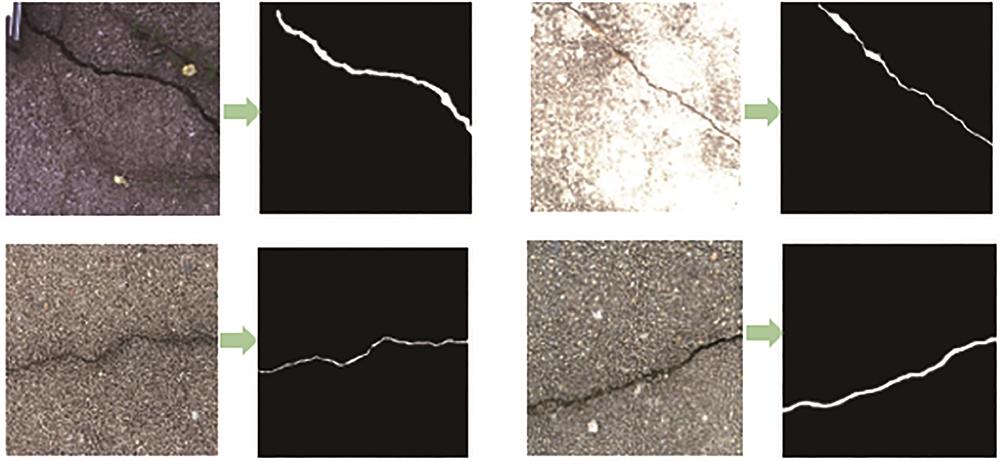
    Fig. 2. Crack segmentation results of U-net
    Comparison between the classical thinning algorithm and the proposed improved algorithm. (a) Classic thinning algorithm;(b) proposed backbone refining algorithm
    Fig. 3. Comparison between the classical thinning algorithm and the proposed improved algorithm. (a) Classic thinning algorithm;(b) proposed backbone refining algorithm
    16 types of neighborhood distribution of backbone points
    Fig. 4. 16 types of neighborhood distribution of backbone points
    Different measurement methods of cracks at the same place
    Fig. 5. Different measurement methods of cracks at the same place
    Judgment of measurement direction using only a single scale feature. (a) Slope feature; (b) neighborhood distribution type feature
    Fig. 6. Judgment of measurement direction using only a single scale feature. (a) Slope feature; (b) neighborhood distribution type feature
    Finding process of measuring points
    Fig. 7. Finding process of measuring points
    Measurable points of a section of crack and its measurement scheme
    Fig. 8. Measurable points of a section of crack and its measurement scheme
    Test equipment and environment
    Fig. 9. Test equipment and environment
    Reduction rate result
    Fig. 10. Reduction rate result
    Recall rate of the proposed width measurement direction judgment method
    Fig. 11. Recall rate of the proposed width measurement direction judgment method
    Direction error of the different methods. (a) Proposed method; (b) method in Ref. [20-21]
    Fig. 12. Direction error of the different methods. (a) Proposed method; (b) method in Ref. [20-21]
    Field measurement test result
    Fig. 13. Field measurement test result
    Deviation between width value and standard value of visual measurement
    Fig. 14. Deviation between width value and standard value of visual measurement
    ParameterMeanMedianMaximumMinimumStandard deviation
    Reduction rate /%6.756.2017.043.012.69
    Table 1. Average value and standard deviation of width measurement error
    ParameterMeanMedianMaximumMinimumStandard deviation
    Recall rate /%70.8671.1283.9958.886.50
    Table 2. Statistical results of the recall rate of the direction judgment method
    MethodDirection error /(°)
    MeanMedianMaximumMinimumStandard deviation
    Proposed method6.896.8610.192.311.92
    Method in Ref.[20-2115.4425.0625.067.993.88
    Table 3. Direction error statistics of the different methods
    ParameterGroup 1Group 2Group 3Group 4Group 5Group 6Group 7Group 8Group 9Mean
    μ¯ /mm0.610.300.220.330.260.260.430.160.270.32
    σ /mm0.320.160.090.110.150.060.100.090.140.19
    Table 4. Width measurement error average value and standard deviation
    Zhaofeng Huang, Yunchao Tang, Xiangjun Zou, Mingyou Chen, Hao Zhou, Tianlong Zou. Visual Measurement of Crack Width Based on Backbone's Two-Scale Fusion of Features[J]. Laser & Optoelectronics Progress, 2022, 59(10): 1015005
    Download Citation