
Xiaoya Li, Zhibin Yu, Dong Liu, Shibin Zhong, Doudou Su. Low-level wind shear characteristic statistic of two runways of Beijing Capital International Airport based on strong wind background[J]. Infrared and Laser Engineering, 2021, 50(12): 20210119
- Infrared and Laser Engineering
- Vol. 50, Issue 12, 20210119 (2021)
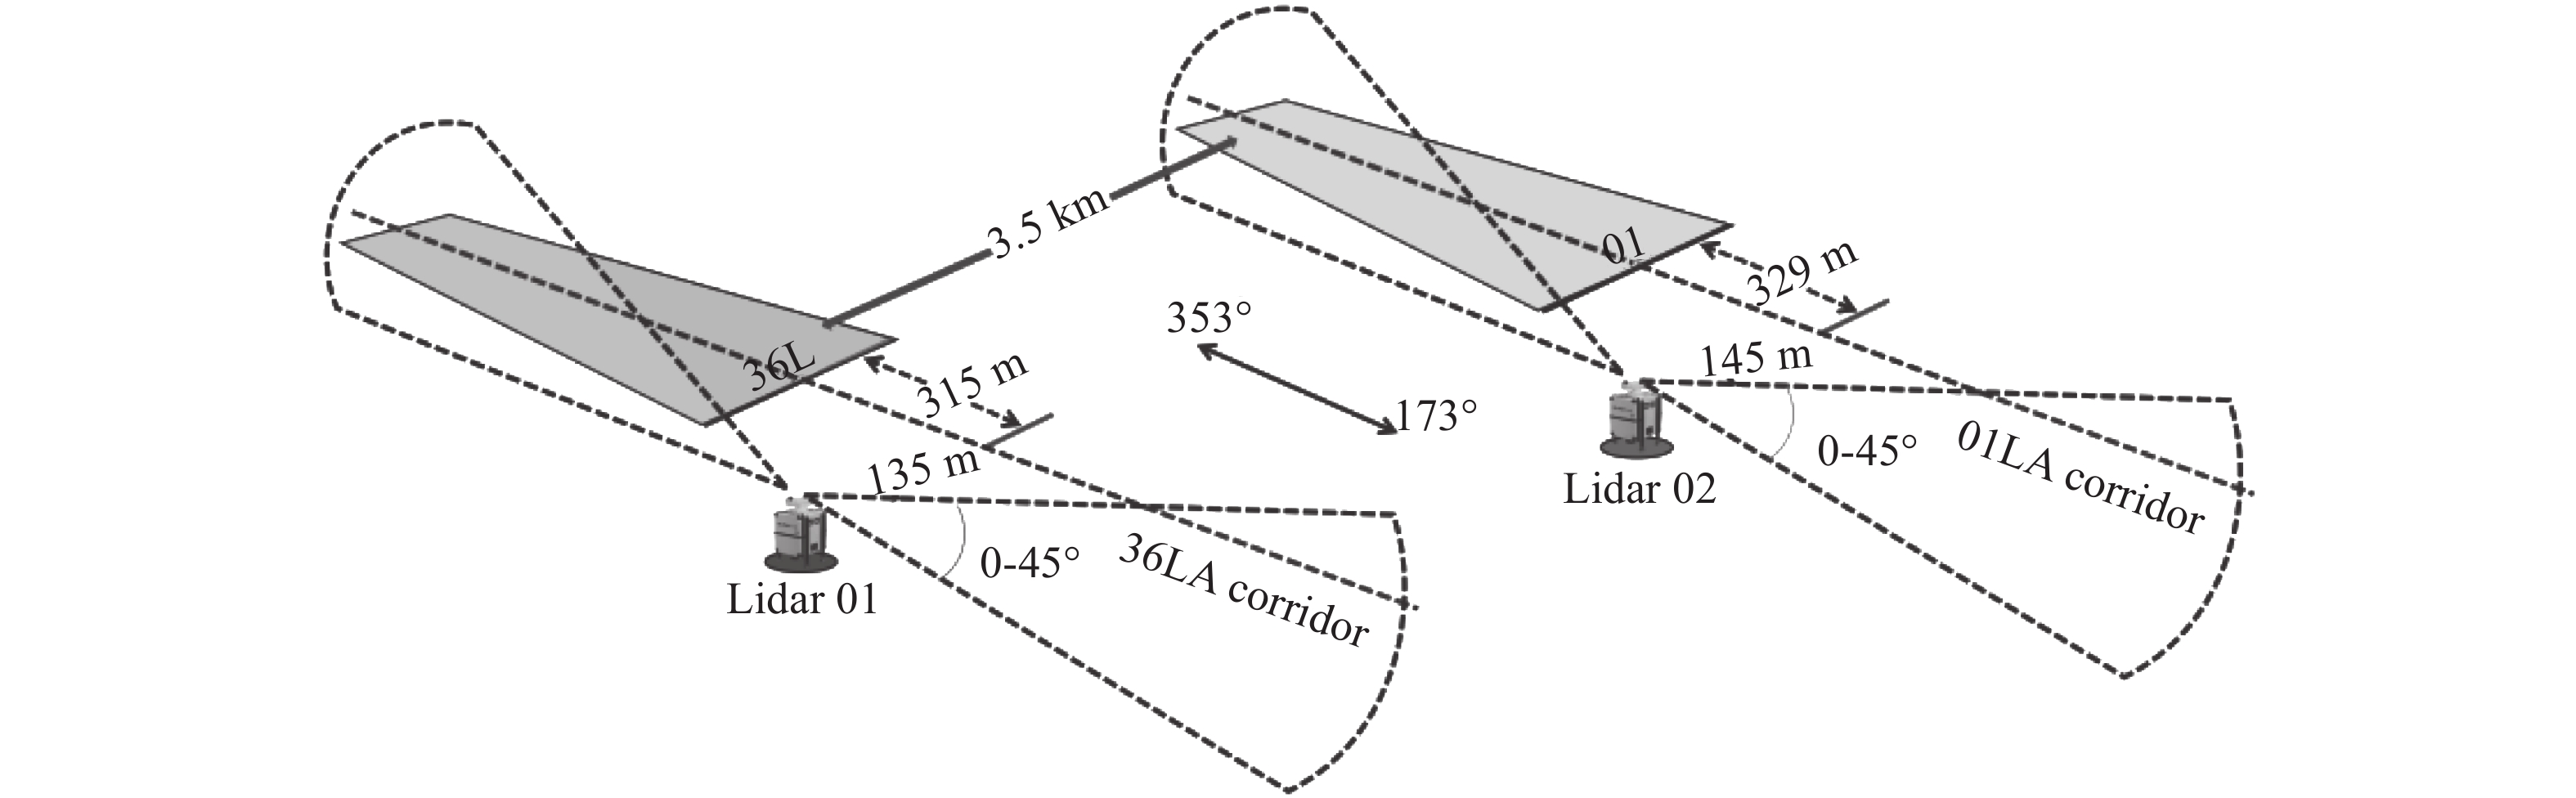
Fig. 1. Schematic diagram of installation position of two lidar
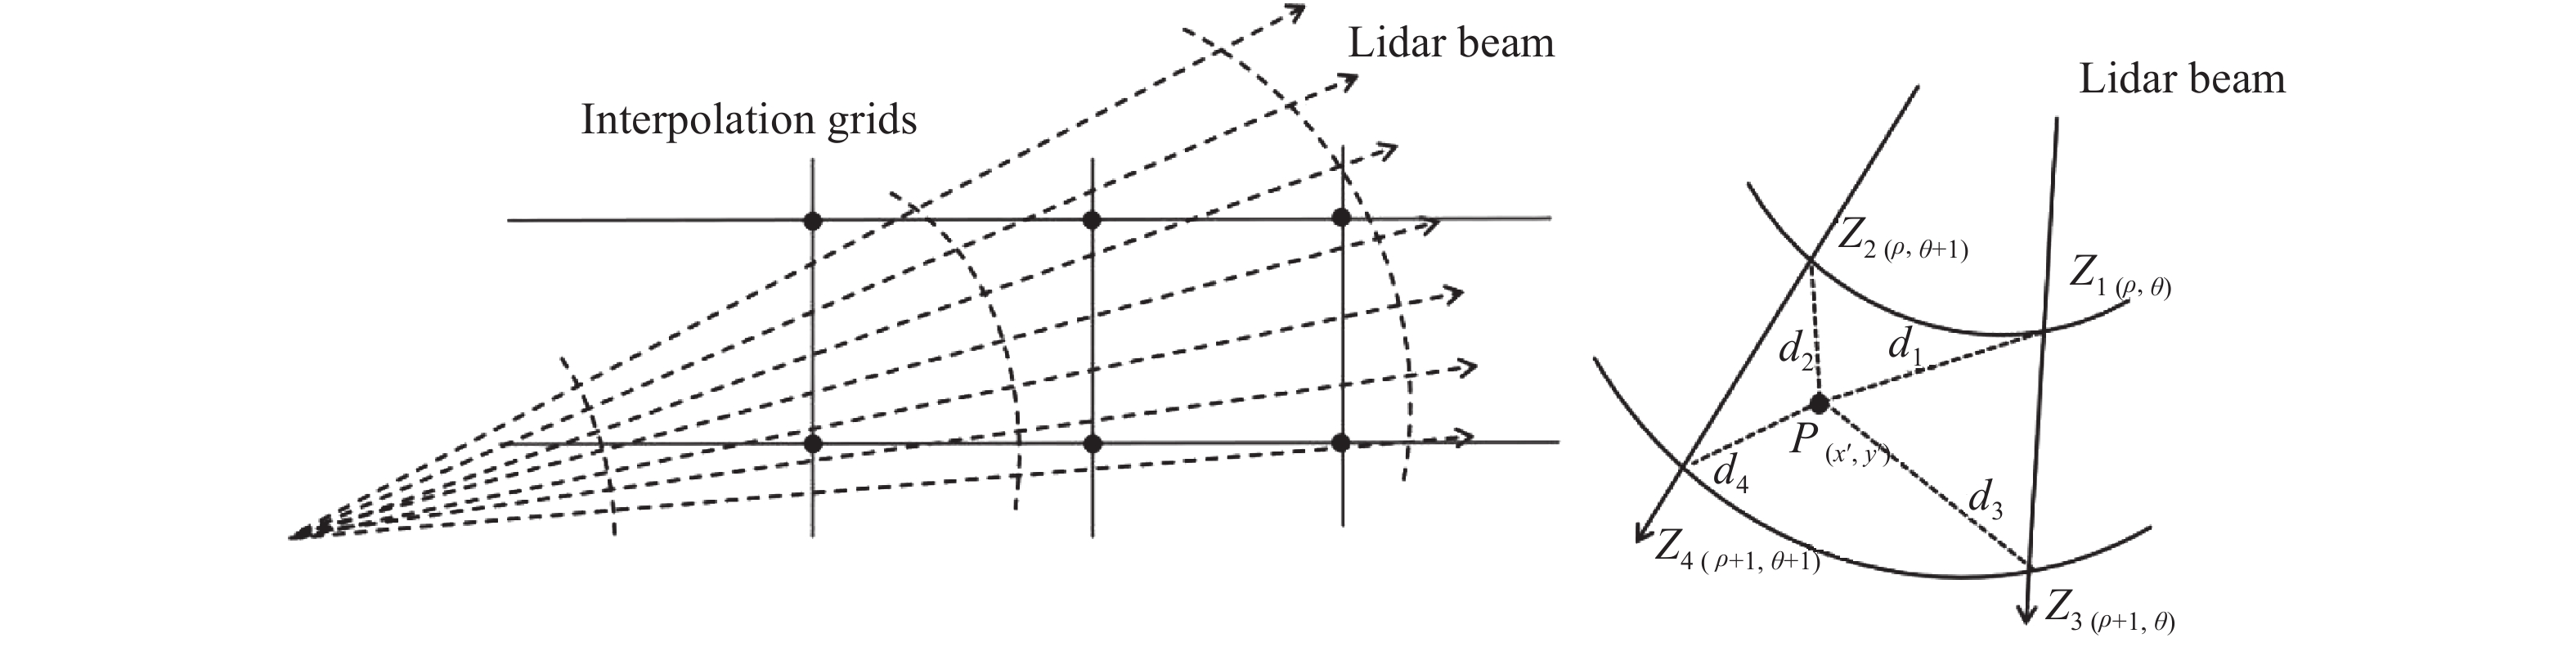
Fig. 2. Schematic diagram of coordinate transform
Fig. 3. Radial wind speed deviation of lidar 01 in all different ranges
Fig. 4. Radial wind speed deviation of lidar 02 in all different ranges
Fig. 5. Statistics of average wind speed on south touch-down zone of three runways in Beijing Capital International Airport
Fig. 6. Schematic diagram of the relative position of glide path to lidar RHI scanning range
Fig. 7. Schematic diagram of headwind profile on glide path
Fig. 8. Schematic diagram of relationship between the distance of two points on the wind profile and the change of wind speed
Fig. 9. Box plots of wind shear intensity on runway 36L and runway 01
Fig. 10. Box plots of horizontal locations (a) and vertical height (b) positions of wind shear events on runway 36L and runway 01
| |||||||||||||||||||||||||||||||||||||||||||||||
Table 1. Division of wind speed and direction range based on METAR report
| ||||||||||||||||||||||||||
Table 2. Statistics of low-level wind shear frequencies

Set citation alerts for the article
Please enter your email address
© Copyright 2018-2021 | Chinese Laser Press. All Rights Reserved 沪ICP备15018463号-20