• Journal of Infrared and Millimeter Waves
  • Vol. 40, Issue 4, 471 (2021)
Jia-Feng ZHENG1、2、*, Hua YANG1、3, Zheng-Mao ZENG4, Li-Ping LIU3, Ming-Long ZOU1、3, and Zhen-Yu ZENG1、3
Author Affiliations
  • 1School of Atmospheric Sciences, Chengdu University of Information Technology, Chengdu 610225, China
  • 2Key Laboratory of Transportation Meteorology, China Meteorological Administration, Nanjing 210008, China
  • 3State Key Laboratory of Severe Weather, Chinese Academy of Meteorological Sciences, Beijing 100081, China
  • 4Fujian Meteorological Information Center, Fujian Meteorological Bureau, Fuzhou 360001, China
  • show less
    DOI: 10.11972/j.issn.1001-9014.2021.04.006 Cite this Article
    Jia-Feng ZHENG, Hua YANG, Zheng-Mao ZENG, Li-Ping LIU, Ming-Long ZOU, Zhen-Yu ZENG. Cloud macro-physical characteristics over Nagqu in summer observed by a millimeter-wave radar[J]. Journal of Infrared and Millimeter Waves, 2021, 40(4): 471 Copy Citation Text show less
    A flow chart of the retrieval of cloud macro-physical parameters using Ka-MMCR measurements
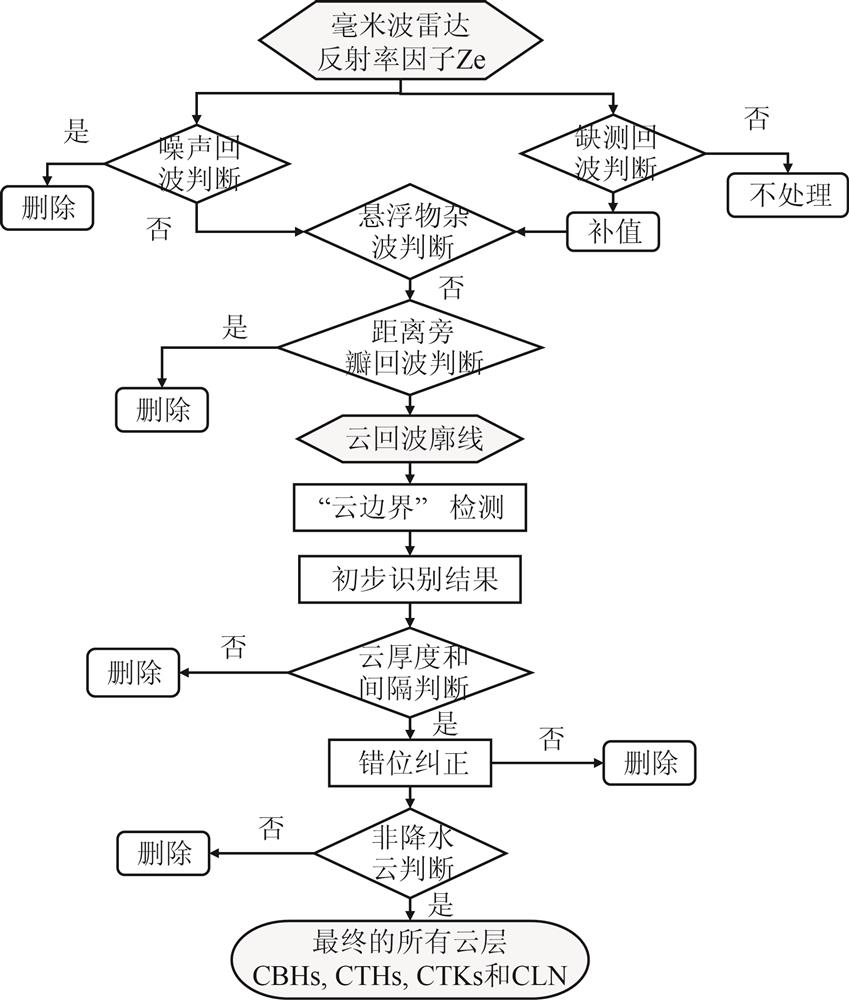
    Fig. 1. A flow chart of the retrieval of cloud macro-physical parameters using Ka-MMCR measurements
    Retrieval results for cumulonimbus and stratocumulus clouds on August 31, 2015, (a) and (b) are radar reflectivity before and after sidelobe removal, (c) and (d) are radar-retrieved CBHs and CTHs for previous and our methods, 1st and 2nd denote the first-layer and second-layer clouds
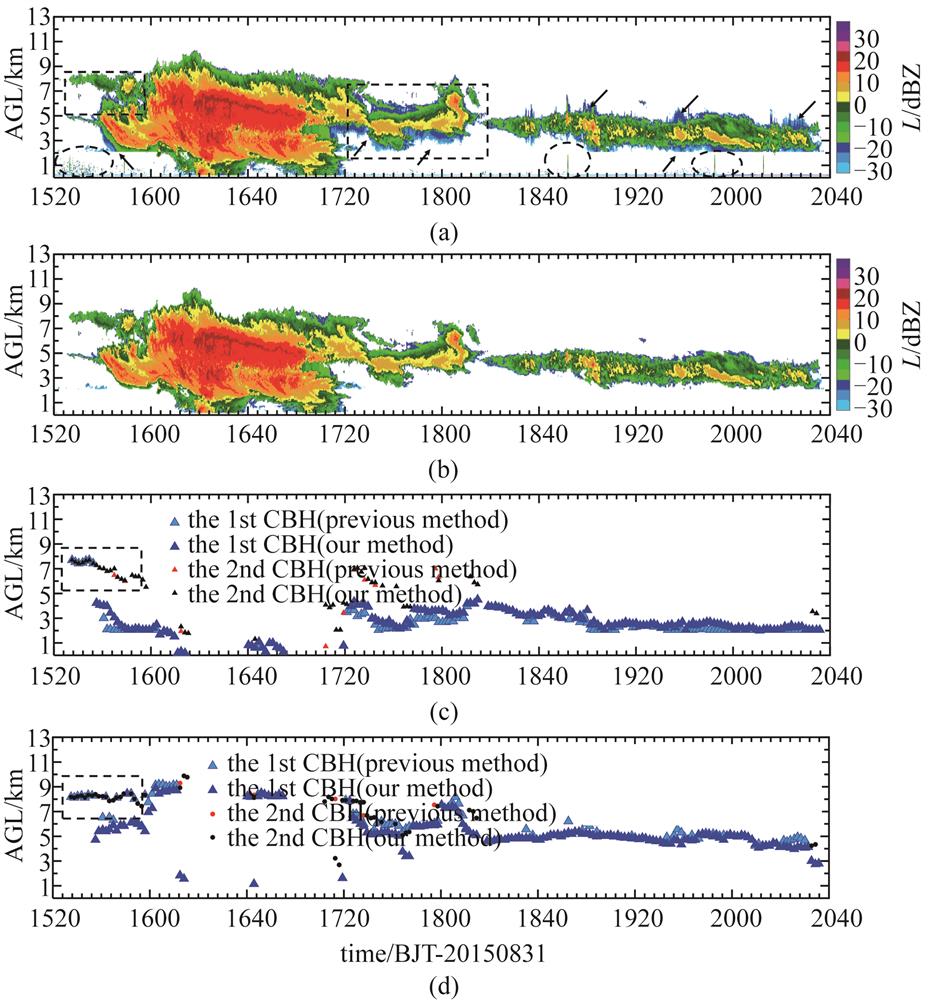
    Fig. 2. Retrieval results for cumulonimbus and stratocumulus clouds on August 31, 2015, (a) and (b) are radar reflectivity before and after sidelobe removal, (c) and (d) are radar-retrieved CBHs and CTHs for previous and our methods, 1st and 2nd denote the first-layer and second-layer clouds
    Comparisons of MMCR- and CL31 derived CBHs (a), and comparisons of MMCR- and HW8- derived CTHs (b); the black and red crosses indicate non-precipitating and precipitating cases, respectively, and the black dashed lines denote the equal lines
    Fig. 3. Comparisons of MMCR- and CL31 derived CBHs (a), and comparisons of MMCR- and HW8- derived CTHs (b); the black and red crosses indicate non-precipitating and precipitating cases, respectively, and the black dashed lines denote the equal lines
    Deviations between the MMCR- and CL31- derived CBHs (∆CBH) and between the MMCR- and HW8- derived CTHs (∆CTH), (a) and (b) represent non-precipitating clouds, (c) and (d) represent precipitating clouds, the case number N, the average μ, and the standard deviation σ for deviations are shown in each panel
    Fig. 4. Deviations between the MMCR- and CL31- derived CBHs (CBH) and between the MMCR- and HW8- derived CTHs (CTH), (a) and (b) represent non-precipitating clouds, (c) and (d) represent precipitating clouds, the case number N, the average μ, and the standard deviation σ for deviations are shown in each panel
    Occurrences of the MMCR-retrieved CBHs (a), CTHs (b), and CTKs (c) at different height levels during the observation period, and comparisons of the retrievals of CLNs (d), CBHs (e), and CTHs (f) derived by the MMCR, CL31, and HW8
    Fig. 5. Occurrences of the MMCR-retrieved CBHs (a), CTHs (b), and CTKs (c) at different height levels during the observation period, and comparisons of the retrievals of CLNs (d), CBHs (e), and CTHs (f) derived by the MMCR, CL31, and HW8
    Diurnal variations of the MMCR-derived CBH (a), CTH (b), CTK (c), and CF (d); each hour corresponds to a boxplot, in which the bottom and top edges of the box indicate the 25th and 75th percentiles, the central cross-bar indicates the median, the upper and lower dotted line extend to the maximum and minimum; the solid lines with circles represent the averages; (e) is the statistical comparison of CBHs between MMCR and CL31; (f) is the statistical comparison of CTHs between MMCR and HW8
    Fig. 6. Diurnal variations of the MMCR-derived CBH (a), CTH (b), CTK (c), and CF (d); each hour corresponds to a boxplot, in which the bottom and top edges of the box indicate the 25th and 75th percentiles, the central cross-bar indicates the median, the upper and lower dotted line extend to the maximum and minimum; the solid lines with circles represent the averages; (e) is the statistical comparison of CBHs between MMCR and CL31; (f) is the statistical comparison of CTHs between MMCR and HW8
    Radar reflectivities of mixed precipitating clouds observed by the CWR (a) and MMCR (b) at Yangjiang of Guangdong on June 10, 2014; (c) and (d) are radar-derived CTHs and corresponding ground minutely rain rate R
    Fig. 7. Radar reflectivities of mixed precipitating clouds observed by the CWR (a) and MMCR (b) at Yangjiang of Guangdong on June 10, 2014; (c) and (d) are radar-derived CTHs and corresponding ground minutely rain rate R
    Radar reflectivities of CWR (a), MMCR before (b) and after (c) sidelobe removal for convective clouds and precipitation that happened at Yangjiang of Guangdong on April 15, 2014
    Fig. 8. Radar reflectivities of CWR (a), MMCR before (b) and after (c) sidelobe removal for convective clouds and precipitation that happened at Yangjiang of Guangdong on April 15, 2014
    Frequency distributions of CBH and CTH retrieved biases for 50 simulated cloud profiles
    Fig. 9. Frequency distributions of CBH and CTH retrieved biases for 50 simulated cloud profiles
    (a)10 Minimum reflectivities at different height levels observed by the MMCR during the observational period, and(b) probability distribution functions of radar reflectivities corresponding to the retrieved CBHs and CTHs
    Fig. 10. (a)10 Minimum reflectivities at different height levels observed by the MMCR during the observational period, and(b) probability distribution functions of radar reflectivities corresponding to the retrieved CBHs and CTHs

    云宏观参数

    反演误差

    云类误差统计量 /km
    5th25th50th75th95th平均数标准差
    ΔCBHAC0.030.120.330.601.170.450.53
    LC0.030.090.180.330.480.230.21
    MC0.030.210.510.691.080.490.35
    HC0.030.090.330.751.740.650.93
    ΔCTHAC-2.22-1.05-0.60-0.18-0.03-0.961.37
    LC-2.01-1.02-0.63-0.24-0.03-0.971.36
    MC-2.37-1.08-0.51-0.12-0.03-1.011.47
    HC-1.83-0.99-0.18-0.03-0.03-0.640.89
    ΔCTKAC-2.1-1.02-0.57-0.21-0.03-0.790.97
    LC-1.86-0.96-0.48-0.15-0.03-0.791.15
    MC-1.95-1.08-0.57-0.21-0.03-0.851.07
    HC-1.23-0.57-0.27-0.06-0.03-0.430.57
    Table 1. Statistical results of ΔCBH, ΔCTH and ΔCTK for different cloud types after sidelobe removal
    Jia-Feng ZHENG, Hua YANG, Zheng-Mao ZENG, Li-Ping LIU, Ming-Long ZOU, Zhen-Yu ZENG. Cloud macro-physical characteristics over Nagqu in summer observed by a millimeter-wave radar[J]. Journal of Infrared and Millimeter Waves, 2021, 40(4): 471
    Download Citation