Author Affiliations
1College of Geography and Environmental Science, Northwest Normal University, Lanzhou 730070, China2Tourism College, Inner Mongolia Normal University, Huhhot 010022, Chinashow less
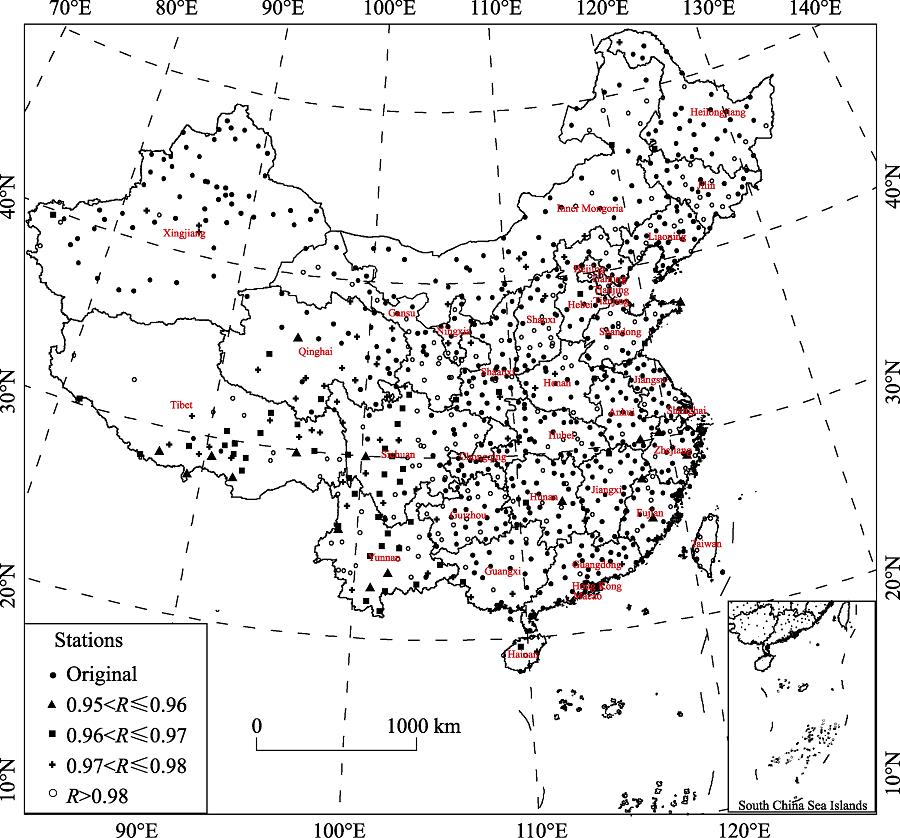
Fig. 1. Location of the meteorological stations. R is the goodness of fit between missing data and completion data in China
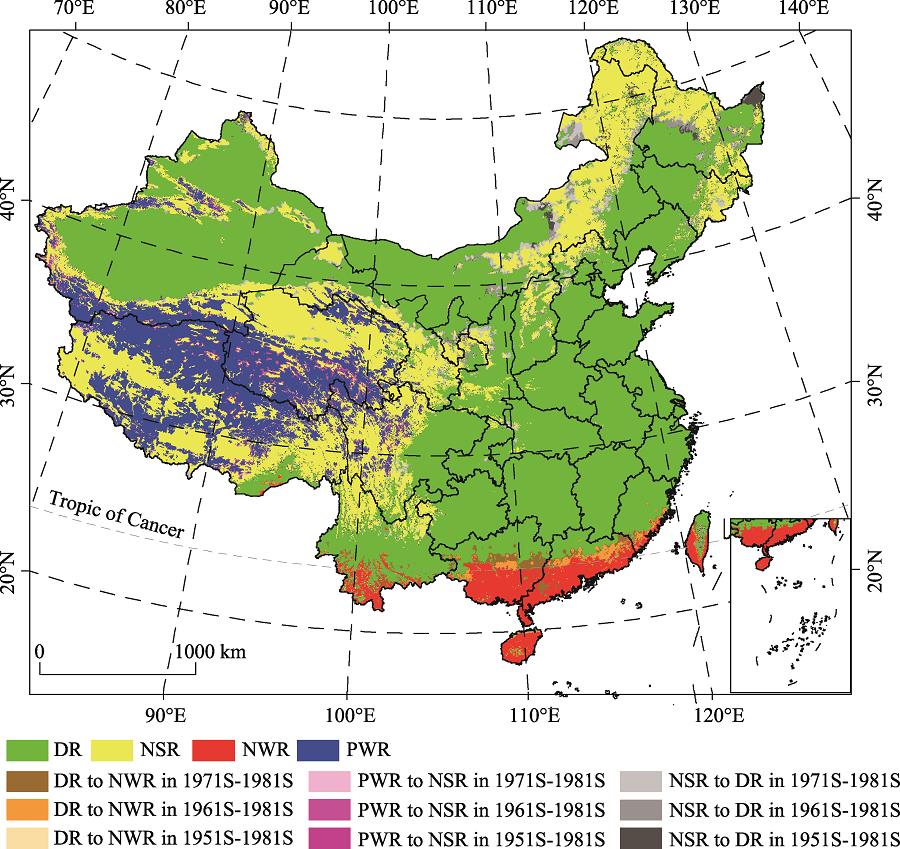
Fig. 2. Spatial distribution of climatic seasonal regions in different Climate Normals in China
Fig. 3. Spatial distribution of spring, summer, autumn and winter duration in different Climate Normals in China
Fig. 4. Linear trends and cumulative anomaly curves in different climatic seasonal regions from 1951 to 2017
Fig. 5. Spatial distribution of expanded area for climatic seasonal regions in China after 1994
Fig. 6. Trends of spring, summer, autumn and winter durations from 1951 to 2017
Fig. 7. Trends of the spring, summer, autumn and winter starting dates in China from 1951 to 2017
| Seasons | Spring | Summer | Autumn | Winter |
|---|
| Threshold | $10\ \le T{{\overline{M}}_{j}}<22\ $℃ | $T{{\overline{M}}_{j}}\ge 22\ $℃ | $10\ \le T{{\overline{M}}_{j}}<22\ $℃ | $T{{\overline{M}}_{j}}<10\ $℃ |
|
Table 1. Threshold temperatures for different climatic seasons
| Climatic seasons regions | Abbreviation | Threshold for the temperature of tenderness |
|---|
| Perennial-winter region | PWR | $T{{\overline{M}}_{j}}<10$℃ | | Perennial-summer region | PSuR | $T{{\overline{M}}_{j}}\ge 22$℃ | | Perennial-spring region | PSpR | $10\le T{{\overline{M}}_{j}}<22$℃ | | No-winter region | NWR | $T{{\overline{M}}_{j}}\ge 10$℃ | | No-summer region | NSR | $T{{\overline{M}}_{j}}<22$℃ | | Discernible region | DR | Except the above five cases |
|
Table 2. Definition of normal climatic seasonal regions
| Climate Normal | Threshold | Multiple regression model | R2 | Significance level |
|---|
| 1951-1980 | 10 ℃ | $\begin{align} & Y=4014.82\text{+}41.71\times \theta \text{+}0.003\times {{\theta }^{3}}-4.32\times \text{sin}\theta -1280.2\times \\ & \ \ \ \ \ \ \text{ln}\theta -119.38\times \text{ln}\varphi -0.02\times h \\ \end{align}$ | 0.97 | 0.001 | | 22 ℃ | $\begin{align} & Y=3461.58+93.51\times \theta -0.65\times {{\theta }^{2}}\text{+}2.42\times \text{sin}\theta -1759.02\times \\ & \ \ \ \ \ \ \text{ln}\theta -121.4\times \text{ln}\varphi -0.09\times h \\ \end{align}$ | 0.958 | 0.001 | | 1961-1990 | 10 ℃ | $\begin{align} & Y=4025.87\text{+}41.94\times \theta -0.003\times {{\theta }^{3}}-4.28\times \text{sin}\theta -1285.43\times \\ & \ \ \ \ \ \ \text{ln}\theta -119.33\times \text{ln}\varphi -0.02\times h \\ \end{align}$ | 0.97 | 0.001 | | 22 ℃ | $\begin{align} & Y=3461.57\text{+}93.51\times \theta -0.65\times {{\theta }^{2}}\text{+}2.42\times \text{sin}\theta -1759.02\times \\ & \ \ \ \ \ \ \text{ln}\theta -121.4\times \text{ln}\varphi -0.09\times h \\ \end{align}$ | 0.958 | 0.001 | | 1971-2000 | 10 ℃ | $\begin{align} & Y=4009.6\text{+}41.7\times \theta -0.003\times {{\theta }^{3}}-5.39\times \text{sin}\theta -1280.05\times \\ & \ \ \ \ \ \ \text{ln}\theta -118.44\times \text{ln}\varphi -0.02\times h \\ \end{align}$ | 0.97 | 0.001 | | 22 ℃ | $\begin{align} & Y=3682.63\text{+}105.4\times \theta -0.74\times {{\theta }^{2}}\text{+}1.75\times \text{sin}\theta -1964.13\times \\ & \ \ \ \ \ \ \text{ln}\theta -165.82\times \text{ln}\varphi -0.1\times h \\ \end{align}$ | 0.958 | 0.001 | | 1981-2010 | 10 ℃ | $\begin{align} & Y=3801.72\text{+}38.03\times \theta -0.003\times {{\theta }^{3}}-5.44\times \text{sin}\theta -1193.74\times \\ & \ \ \ \ \ \ \text{ln}\theta -114.2\times \text{ln}\varphi -0.02\times h \\ \end{align}$ | 0.97 | 0.001 | | 22 ℃ | $\begin{align} & Y=3395.83\text{+}67.93\times \theta -0.006\times {{\theta }^{3}}\text{+}2.1\times \text{sin}\theta -1671.14\times \\ & \ \ \ \ \ \ \text{ln}\theta -147\times \text{ln}\varphi -0.1\times h \\ \end{align}$ | 0.959 | 0.001 |
|
Table 3. Multiple regression models for climatic seasonal length simulation in China for different Climate Normals
| Station | R | S | RSME | Station | R | S | RSME |
|---|
| Hailar | 0.99 | 61.21 | 5.05 | Dardo | 0.99 | 79.33 | 22.77 | | Karamay | 0.98 | 47.87 | 23.47 | Yanyuan | 0.99 | 109.76 | 17.15 | | Korla | 0.99 | 56.08 | 19.86 | Zhanyi | 0.99 | 124.65 | 24.16 | | Yarkant | 0.99 | 62.22 | 5.61 | Gaoping | 0.99 | 77.55 | 4.40 | | Naomaohu | 0.98 | 44.79 | 17.10 | Shuangfeng | 0.99 | 63.33 | 4.76 | | Jiuquan | 0.99 | 72.03 | 15.55 | Xuzhou | 0.99 | 57.50 | 3.45 | | Gonghe | 0.99 | 61.20 | 10.06 | Anqing | 0.99 | 62.44 | 3.26 | | Urad Zhongqi | 0.99 | 68.65 | 6.08 | Wenzhou | 0.99 | 77.66 | 6.83 | | Houma | 0.99 | 58.18 | 3.94 | Du’an | 0.99 | 88.15 | 3.00 | | Changchun | 0.99 | 56.58 | 4.68 | Meixian | 0.99 | 87.59 | 6.98 | | Qinglong | 0.99 | 60.40 | 4.03 | Tainan | 0.99 | 76.59 | 48.13 | | Sog | 0.98 | 35.70 | 8.39 | Qionghai | 0.99 | 60.24 | 16.26 |
|
Table 4. The R, S and RMSE between measured and simulated values of the validation site