Bin MA, Bo ZHANG, Lige JIA. Spatio-temporal variation in China’s climatic seasons from 1951 to 2017[J]. Journal of Geographical Sciences, 2020, 30(9): 1387
Copy Citation Text
In this paper, meteorological industry standard, daily mean temperature, and an improved multiple regression model are used to calculate China’s climatic seasons, not only to help understand their spatio-temporal distribution, but also to provide a reference for China’s climatic regionalization and crop production. It is found that the improved multiple regression model can accurately show the spatial distribution of climatic seasons. The main results are as follows. There are four climatic seasonal regions in China, namely, the perennial-winter, no-winter, no-summer and discernible regions, and their ranges basically remained stable from 1951 to 2017. The cumulative anomaly curve of the four climatic seasonal regions clarifies that the trend of China’s climatic seasonal regions turned in 1994, after which the area of the perennial-winter and no-summer regions narrowed and the no-winter and discernible regions expanded. The number of sites with significantly reduced winter duration is the largest, followed by the number of sites with increased summer duration, and the number of sites with large changes in spring and autumn is the least. Spring advances and autumn is postponed due to the shortened winter and lengthened summer durations. Sites with significant change in seasonal duration are mainly distributed in Northwest China, the Sichuan Basin, the Huanghe-Huaihe-Haihe (Huang-Huai-Hai) Plain, the Northeast China Plain, and the Southeast Coast.
The alternation of seasons is caused by the Earth’s revolution and solar radiation, which lead to the latitudinal and altitudinal heat redistribution and cold-hot alternation (Jaagus and Ahas, 2000; Jaagus et al., 2003). In the context of global warming (Cubasch et al., 2013; Blunden and Arndt, 2016; 2017), not only are global and regional extreme precipitation events, extreme high temperature events, droughts, and heat waves occurring but also tropical storms are increasing (Fischer and Knutti, 2015; Gensini and Mote, 2015; Mazdiyasni and Aghakouchak, 2015). Atmospheric radiation causes heat to rise continuously above the original foundation, causing direct or indirect influence on human existence and development. The increase of temperature not only slows down crop growth (Lobell and Tebaldi, 2014) but also decreases grain production (Asseng et al., 2015). At the same time, it causes the spring phenophase and crop planting to shift to an earlier date (Jiang et al., 2011; Vitasse et al., 2011; Wang et al., 2011; Choi et al., 2016; Liang and Zhang, 2016). The frost-free period and the warm season are lengthened (Allen and Sheridan, 2016; Erlat and Türkeş, 2016; Wypych et al., 2017). Therefore, analysing the potential impact of temperature changes helps to improve our understanding of global warming and develop a method to adapt to climate change.
China is vulnerable to climate change due to the vast land and uneven terrain. Some recent studies have revealed that the average temperature in China is rising faster than the global average (PCNARCC, 2015; Peng et al., 2016; Chen et al., 2018). The rising temperature brings about changes in biological development and growth environments (Shen et al., 2016; Liu et al., 2010), resulting in evolution of an organism’s adaptability to the environment (Shi et al., 2014; Liu et al., 2017). Seasons have been considered important for agricultural production in China for thousands of years. Chang (1934) firstly proposed a method for dividing China’s seasons, which has been used in China. Some researchers found that China’s seasons have varied with climate change in recent years. Both Yan et al. (2011) and Dong et al. (2010) found that the duration of summer in China is increasing, and the duration of winter is decreasing. Miao and Wang (2007) revealed that the start dates of spring and summer are gradually delayed from south to north in China. However, their research mainly focused on the duration and start dates of China’s climatic seasons, and there are few studies on climatic seasonal regionalization. In 2012, a universal climatic seasonal division standard (QX/T 152-2012) was made public by the China Meteorological Administration. Therefore, studying variations of China’s climatic seasonal regionalization is significant for meteorological forecasting.
In this study, an improved multiple regression method is used to calculate the spatial distribution of climatic seasonal regionalization. The principal types of climatic seasons present in China are also revealed. At the same time, the climatic season classification criteria are utilized to calculate the trends of the duration and start dates of the climatic seasons. In this paper, the spatio-temporal distribution of China’s climatic seasons is analysed in detail. Additionally, a reference for the meteorological service industry is presented.
2 Data
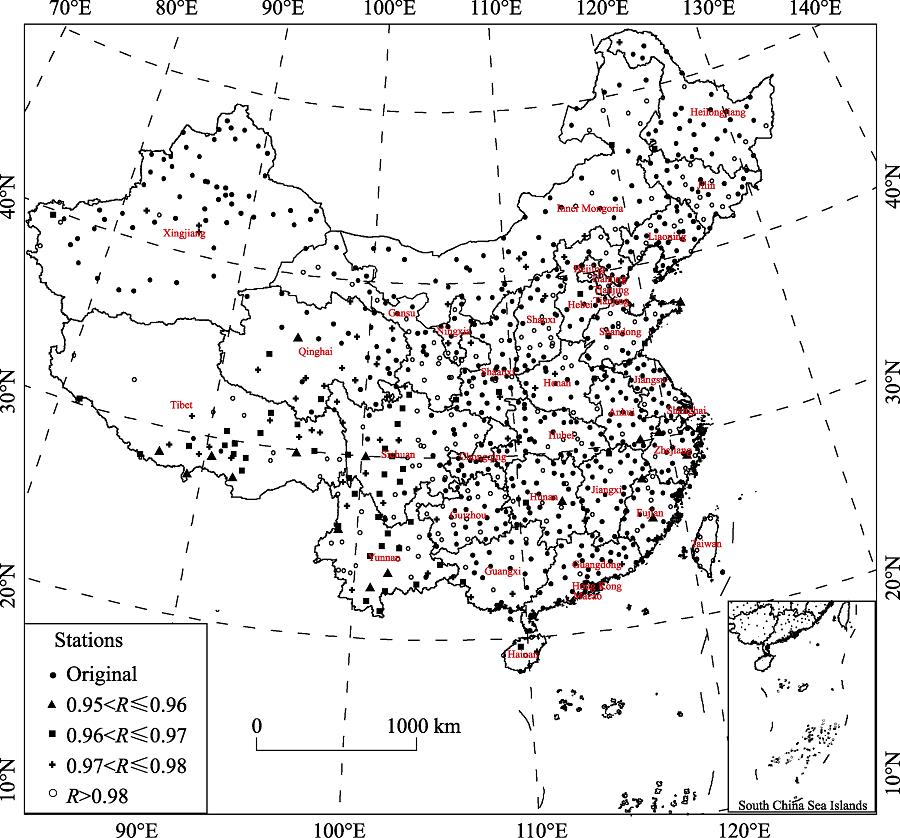
The datasets of daily mean surface air temperature in China are collected separately from the China Meteorological Administration (http://data.cma.cn/) and Tutiempo. Net (https://en.tutiempo.net/), covering the period from January 1, 1951 to December 31, 2017. The breakpoints of surface meteorological data are calculated by the transPMFred method (Wang, 2007; Wang et al., 2007), and the records of 92 sites are found to be in accordance to the brief history of China’s basic meteorological stations. Then, the quantile-matching (QM) (Wang et al., 2014) adjustment method is used to homogenize such artificial data shifts from station migrations. To ensure data integrity and continuity, missing data are estimated through a multiple linear regression analysis (MLRA) approach along with the daily maximum, minimum, and average temperatures of nearby sites. The fitting degree R, calculated by MLRA in Figure 1, is higher than 0.95. It is higher than 0.995 in the plain areas, and between 0.95-0.99 in the mountain and plateau areas. Considering the amount of estimated and measured data for the climatic seasons, errors caused by estimated data are negligible.
Figure 1.
Location of the meteorological stations. <italic>R </italic>is the goodness of fit between missing data and completion data in China
Seasonal temperature thresholds are defined variously in different regions. In this study, the approach proposed by climatic seasonal division standard (QX/T 152-2012) is used to classify China’s climatic seasons, and it has been widely promoted by the Chinese meteorological department. A few concepts are included as follows:
3.1.1 Normal climatic seasons
The normal climatic seasons refer to seasons during Climate Normals. The start dates, end dates and duration of normal climatic seasons are determined by the five-point smoother temperature of the perennial series. The formulas are as follows:
where $T{{\overline{M}}_{j}}$(℃) is the five-point smoother temperature of the perennial series on the jth day; tj (℃) is the temperature of the perennial series on the jth day; tij (℃) is the surface air average temperature on the jth day of the i year; and n is the normal climate for 30 years. The start date of a climatic season is the first day of the first five consecutive days with the same threshold temperature. Threshold temperatures for different climatic seasons are shown in Table 1.
Seasons
Spring
Summer
Autumn
Winter
Threshold
$10\ \le T{{\overline{M}}_{j}}<22\ $℃
$T{{\overline{M}}_{j}}\ge 22\ $℃
$10\ \le T{{\overline{M}}_{j}}<22\ $℃
$T{{\overline{M}}_{j}}<10\ $℃
Table 1.
Threshold temperatures for different climatic seasons
Normal climatic seasonal areas can be defined by the durations of the climatic seasons. When the climatic seasonal duration is more than 5 days in an area, the season is stable. Table 2 shows the threshold for the perennial temperature series.
If the start date of a season calculated for the first time is over 15 days earlier than the normal climatic seasonal date, a second judgement should be made. If the initial 5-day continuous sliding average temperature sequence does not meet the season’s indicator, the sequence must be calculated again for them to meet. When the cumulative number of days that meet the season’s indicator is greater than or equal to the number of unsatisfied days during two consecutive processes, the start date of the initial judgement is taken as the start date of the climatic season. Otherwise, the second judgement will be taken.
3.2 Simulation of climatic seasonal spatial distribution
The spatio-temporal continuity of temperature is the best among all the meteorological elements. There are linear relationships between temperature spatial distribution and altitude, latitude and longitude (Flocas et al., 1983). Dai et al. (2015) found multiple linear relationships between the derivative accumulated temperature with altitude, latitude and longitude. In this paper, their method is improved by introducing new parameters such as the functions of altitude, latitude or longitude. The multiple regression formula is as follows:
where Y is the derivative of temperature; θ, φ, and h are latitude (°), longitude (°) and altitude (m) respectively; a1, a2, a3, an…, b1… bn, c1… cn are the undetermined coefficients; and f(ε) is the residual error between the simulated and measured values. The maps of spatial distribution and difference of the temperature derivative drawn by the raster calculator in ArcGIS, and the digital elevation model (DEM) with 1 km resolution are available at http://vterrain.org/Elevation/SRTM/.
The distribution of climatic seasons is determined by the climatic seasonal duration. The spatial distribution formula of the climatic seasonal duration is obtained by a multiple regression model. The formula in Table 3 illustrates the multivariate regression relationship between the climatic seasonal duration and altitude, as well as latitude and longitude. The significance level in the model exceeds 0.99 and the fitting degree exceeds 0.95. The fitting degree of seasonal duration greater than 10 ℃ is even as high as 0.97.
The accuracy of the multiple regression simulation is verified by using the correlation coefficient (R2), standard deviation (S) and root mean square error (RMSE), which are calculated by simulating and measuring the annual climatic seasonal duration values of 24 weather stations randomly selected from different terrain units in China. The R for all stations is greater than 0.98, indicating that the simulated and measured values are consistent. However, the S and RMSE of the plain areas are lower than those of the plateau areas, and their simulations are better than those of the plateau areas. These findings indicate that the multiple regression simulation is feasible and suitable for simulating the spatial distribution of climatic seasons on a large scale (Table 4).
Station
R
S
RSME
Station
R
S
RSME
Hailar
0.99
61.21
5.05
Dardo
0.99
79.33
22.77
Karamay
0.98
47.87
23.47
Yanyuan
0.99
109.76
17.15
Korla
0.99
56.08
19.86
Zhanyi
0.99
124.65
24.16
Yarkant
0.99
62.22
5.61
Gaoping
0.99
77.55
4.40
Naomaohu
0.98
44.79
17.10
Shuangfeng
0.99
63.33
4.76
Jiuquan
0.99
72.03
15.55
Xuzhou
0.99
57.50
3.45
Gonghe
0.99
61.20
10.06
Anqing
0.99
62.44
3.26
Urad Zhongqi
0.99
68.65
6.08
Wenzhou
0.99
77.66
6.83
Houma
0.99
58.18
3.94
Du’an
0.99
88.15
3.00
Changchun
0.99
56.58
4.68
Meixian
0.99
87.59
6.98
Qinglong
0.99
60.40
4.03
Tainan
0.99
76.59
48.13
Sog
0.98
35.70
8.39
Qionghai
0.99
60.24
16.26
Table 4.
The R, S and RMSE between measured and simulated values of the validation site
4.1 Spatial distribution of the normal climatic seasons
The spatial distribution of climatic seasons in the four Climate Normals (1951-1980, 1961-1990, 1971-2000, and 1981-2010) is calculated by multiple regression models. Figure 2 illustrates the spatial distribution of China’s main normal climatic seasons after superimposed analysis. The no-winter region (NWR) is situated south of the Tropic of Cancer in Guangxi Province, Guangdong Province, Hainan Island, the lower altitudes of the southwest and northeast Taiwan Province, and the lower valleys of Yunnan Province. The distribution area accounts for 4% of the country. The average annual temperature in the region is >10 °C. The durations of spring and autumn are shorter, and the duration of summer is longer. Located in the Qilian Mountains, the Tianshan Mountains, the Karakorum Mountains, the Gangdise Mountains and the Himalayas, the perennial-winter region (PWR) has an average altitude of more than 4,000 m and a distribution area that is approximately 10.5% of China. This area is an alpine region, and the average annual temperature is below 10 °C. The no-summer region (NSR) is located in the Qinghai-Tibet Plateau, Tianshan Mountains, Altai Mountains, Da (Greater) and Xiao (Lesser) Hinggan Mountains and Changbai Mountains, accounting for 27.5% of China. In addition to the other three climatic seasons, the rest of the area is the discernible region (DR), accounting for 58% of China.
The seasonal variation in area for the climatic seasons among different Climate Normals is not obvious. It can be seen from Figure 2 that the proportion of the NWR is gradually increasing; in the observed area in 1981-2000 it is 0.7% higher than that in 1951-1980. The PWR and NSR areas decreased by 0.89% and 0.51%, respectively, from 1951-1980 to 1981-2010. The NWR expanded north of 24°N, in south Fujian Province, and central Guangxi and Guangdong Province. The PWR narrowed in the Qilian Mountains, the Anyemaqen Mountains and the Bayan Hara Mountains. The NSR narrowed in the Loess Plateau, Da and Xiao Hinggan Mountains and the Qinghai-Tibet Plateau. Among China’s climatic seasons, the NWR did not expand, and the areas of the PWR and the NSR narrowed.
Figure 2.
Spatial distribution of climatic seasonal regions in different Climate Normals in China
4.2 Spatial distribution of climatic seasonal duration in different Climate Normals
The durations of spring, summer, autumn and winter in four Climate Normals are counted in Figure 3. The distribution of spring and autumn is only drawn in the DR and that of summer is drawn in the DR and NWR. It can be seen from Figures 3a-3d that spring duration in China is approximately 60-75 days, which is the longest season. The spring duration is shortening in south Xinjiang and the centre of the Huanghe-Huaihe-Haihe (Huang-Huai-Hai) Plain, but lengthening in north Xinjiang and the northeast Huang-Huai-Hai Plain. Figures 3e-3h show the area where summer lasted for 120-150 days after 1981, the middle reaches of the Yangtze River are extended to the Huaihe River, and this area in the Sichuan Basin is also expanded. The summer duration in the east Huang-Huai-Hai Plain increases to 105-120 days. The autumn duration is mainly between 30-75 days (Figures 3i-3l), and the areas with large variations are mainly distributed in the Sichuan Basin and middle reaches of the Yangtze River. In Figures 3n-3p, except for the Qinghai-Tibet Plateau and the north Greater Hinggan Mountains, the winter duration is less than 240 days. The winter duration in the middle reaches of the Yangtze River (105-120 days) and North China (150-180 days) is shortening. From the comparison between different seasons, it is shown that spring is longer than autumn, especially in south Xinjiang, the Sichuan Basin, and Northeast China Plain. The maximum duration of summer lengthens in the plains of East China.
Figure 3.
Spatial distribution of spring, summer, autumn and winter duration in different Climate Normals in China
4.3 Variations of the climatic seasonal distribution from 1951 to 2017
The method in 3.1.2 is used to determine the climatic seasonal regions for each year from 1951 to 2017, and the proportion of each subregion to China is calculated. The results indicate that the PWR proportion is decreasing, and the NWR, NSR and DR are increasing with the linear trends and fitting formulas in Figure 4. However, the R2 in the formulas suggests that the reduction and increases are insignificant.
Figure 4.
Linear trends and cumulative anomaly curves in different climatic seasonal regions from 1951 to 2017
The cumulative anomaly curves of the climatic seasonal division areas, based on the 1981-2010 Climate Normals, are calculated to evaluate the area variational trend. A similar situation can be found in four cumulative anomaly curves in 1994. The PWR and NSR areas expanded before 1994, while the NWR and DR narrowed. However, the opposite situation occurred after the turning point in 1994. The following characteristics can be found in Figure 5 by comparing the variation in each climatic seasonal area before and after the transition. In the Qinghai-Tibet Plateau, 29% of the NWR areas are replaced by NSR. The 11% areas where the DR replaces the NSR are mainly distributed in the east Inner Mongolia and the south Kailas Range. The areas where the DR replaces the NWR are mainly distributed in south Guangdong Province and Guangxi Province, northern Fujian Province, and southern Yunnan Province. The season with the largest and the most concentrated expansion area is the DR, followed by the NSR and NWR.
Figure 5.
Spatial distribution of expanded area for climatic seasonal regions in China after 1994
4.4 Variations of climatic seasonal start dates and durations from 1951 to 2017
Through previous analyses, the trend of each seasonal duration from 1951 to 2017 is calculated in Figure 6. It can be seen that variations of spring and autumn durations are smaller compared with summer and winter, and the sites are scattered. The summer duration of 364 sites in Figure 6b is significantly lengthened. These sites are located in north Xinjiang, the Inner Mongolian Plateau, the Loess Plateau, the Huang-Huai-Hai Plain, the Northeast China Plain, the middle and lower reaches of the Yangtze River, and the Southeast Hills. The number of sites with summer lengthening 1-2 days per decade is the largest, followed by sites lengthening 2-3 days per decade. The sites with significant reduction in winter duration are mainly distributed in the north of and lower reaches of the Yangtze River, the Yunnan-Guizhou Plateau and the Qinghai-Tibet Plateau. The duration of winter is reduced by 1-2 days per decade in 309 sites, accounting for 62% of all significant reduction sites. The sites with winter duration reduced by more than 1 day per decade account for 94% of all significant reduction sites.
Figure 6.
Trends of spring, summer, autumn and winter durations from 1951 to 2017
The methods in 3.1.1 and 3.1.2 are used to calculate the start date of spring, summer, autumn and winter each. Sen’s slope estimator (Sen, 1968) is applied to evaluate the trend and significance of the change in the start date of each season from 1951 to 2017. The sites with statistically significant differences in climatic season start dates are counted.
There are 327 sites with statistically significant differences in the spring start date (Figure 7a). The start date for almost all sites advances, except for the six stations south of the Yangtze River. The densely populated sites are located in the Yangtze River Delta, the Huang-Huai-Hai Plain, the Northeast China Plain, and the Northwest Arid Region of China. Of the sites examined, 197 stations show an advance of 1-1.5 days per decade, and the sites are mainly distributed in the Huang-Huai-Hai, the Northeast China Plain, and north Xinjiang. There are 51 stations, mainly distributed along the Bohai Rim, the Guanzhong Plain and the Hami Basin, showing an advance of more than 1.5 days per decade. There are 234 sites with obvious changes in the summer start date, mainly distributed in the Huang-Huai-Hai, the plains and lakes in the middle and lower reaches of the Yangtze River, and around the Tropic of Cancer (Figure 7b). Of these sites, 36%, mainly in the plain areas of East China, show an advance of 1-1.5 days per decade. Sites with an advance of more than 1.5 days per decade account for 31% of the sites with significant variations, and they are mainly distributed in the middle reaches of the Yangtze plain, the Loess Plateau and the Bohai Rim region. There are 236 sites with significant variations in the autumn start date, which ranks second after spring (Figure 7c). Those sites are concentrated in the middle and lower reaches of the Yangtze River, South China, the Huang-Huai-Hai, the Northeast China Plain and Xinjiang, and the date postpones by 0.5-1.5 days per decade. In southern Yunnan, the Shandong Peninsula and Northeast China, 61 sites postpone the start date for more than 1.5 days per decade. As in spring, sites with a statistically significant variation in winter start date are mainly distributed in the north Yangtze River (Figure 7d). However, 148 sites distributed in the Yangtze plain, the Yellow River, the Northeast China Plain, and Xinjiang only postpone 0.5-1 day per decade. The sites that postpone the date for more than 1 day per decade are scattered over China.
Figure 7.
Trends of the spring, summer, autumn and winter starting dates in China from 1951 to 2017
In this paper, a criterion for climatic seasonal divisions is used to analyse the spatio-temporal variations of China’s climatic seasons from 1951 to 2017. To use the data from more sites in calculating the climatic seasons, the multiple linear regression method is applied to compensate for the non-recorded average daily temperature. The multiple regression model used to denote the spatial distribution of meteorological elements is also improved. Some highlights in the above analyses are as follows:
(1) After the selected site is verified, the temperature data of the vacancy and the improved multiple regression method can be used to represent the spatial and temporal distribution of climatic seasons in China.
(2) There are four division types for China’s climatic seasons, namely, the PWR, NWR, NSR and DR. The area of NWR, PWR, NSR and DR respectively accounts for 4%, 10.5%, 27.5% and 58% of the China’s land area.
(3) According to the analyses of four Climate Normals and the multi-year climatic seasonal regions, it can be seen that there has been no significant variation in China’s climatic seasonal regions from 1951 to 2017.
(4) The cumulative anomaly curve of the four climatic seasonal areas suggests that the trend of China’s climatic seasonal regions turned in 1994, after which the area of the PWR and NSR narrowed by 29% and 11%, and NWR and DR expanded.
(5) The number of sites with significantly shortened winter duration is the largest, followed by sites with lengthened summer duration, and the number of sites with significant changes in spring and autumn is the least.
(6) The spring comes sooner and the autumn is postponed due to shortened winter and lengthened summer duration.
(7) Sites with significant changes in season duration are mainly distributed in Northwest China, the Sichuan Basin, the Huang-Huai-Hai Plain, the Northeast China Plain, and the Southeast Coast.
Compared with previous studies of multi-climate factors, it is reasonable for this paper to choose only the daily average temperature to explain the large-scale climatic seasonal distribution and climatic regions. In China, with diverse climate types, a unified definition is needed for weather forecasting and monitoring, as well as serving production and people’s daily lives.
[8] et alIntroduction. In: Climate Change 2013: The Physical Science Basis. Contribution of Working Group I to the Fifth Assessment Report of the Intergovernmental Panel on Climate Change. Computational Geometry, 18, 95-123(2013).
[9] et alChanges of annual accumulated temperature over southern China during 1960-2011. Journal of Geographical Sciences, 25, 1155-1172(2015).
[10] Response of the starting dates and the lengths of seasons in Mainland China to global warming. Climatic Change, 99, 81-91(2010).
[11] Dates of frost onset, frost end and the frost-free season in Turkey: Trends, variability and links to the North Atlantic and Arctic Oscillation indices, 1950-2013. Climatic Change, 69, 155-176(2016).
[13] On the estimation of annual and monthly mean values of air temperature over Greece using stepwise multiple regression analysis. Archives for Meteorology Geophysics and Bioclimatology Series B-Theoretical and Applied Climatology, 32, 287-295(1983).
[14] Downscaled estimates of late 21st century severe weather from CCSM3. Climatic Change, 129, 307-321(2015).
[15] Space-time variations of climatic seasons and their correlation with the phenological development of nature in Estonia. Climatic Change, 15, 207-219(2000).
[16] et alSpatial and temporal variability of climatic seasons on the East European Plain in relation to large-scale atmospheric circulation. Climate Research, 23, 111-129(2003).
[18] Coupled spatiotemporal variability of temperature and spring phenology in the Eastern United States. International Journal of Climatology, 36, 1744-1754(2016).
[19] et alSpatiotemporal change in China’s climatic growing season: 1955-2000. Climatic Change, 99, 93-118(2010).
[22] Substantial increase in concurrent droughts and heatwaves in the United States. Proceedings of the National Academy of Sciences of the United States of America, 112, 11484-11489(2015).
[23] Analysis of the division of four seasons in China and its changing characteristics, 693-701(2007).
[24] China’s National Assessment Report on Climate Change(2015).
[25] et alResponse of changes in seasonal soil freeze/thaw state to climate change from 1950 to 2010 across China. Journal of Geophysical Research Earth Surface, 121, 1984-2000(2016).
[26] Estimates of the regression coefficient based on Kendall’s Tau. Publications of the American Statistical Association, 63, 1379-1389(1968).
[29] et alAssessing the effects of climate change on the phenology of European temperate trees. Agricultural and Forest Meteorology, 151, 969-980(2011).
[30] et alSpring temperature change and its implication in the change of vegetation growth in North America from 1982 to 2006. Proceedings of the National Academy of Sciences of the United States of America, 108, 1240-1245(2011).
[31] Accounting for autocorrelation in detecting mean shifts in climate data series using the Penalized Maximal t or F Test. Journal of Applied Meteorology & Climatology, 47, 2423-2444(2007).
[33] Penalized maximal t test for detecting undocumented mean change in climate data series. Journal of Applied Meteorology and Climatology, 46, 916-931(2007).
Bin MA, Bo ZHANG, Lige JIA. Spatio-temporal variation in China’s climatic seasons from 1951 to 2017[J]. Journal of Geographical Sciences, 2020, 30(9): 1387