
Xi Yang, Pavan Chandra Konda, Shiqi Xu, Liheng Bian, Roarke Horstmeyer. Quantized Fourier ptychography with binary images from SPAD cameras[J]. Photonics Research, 2021, 9(10): 1958
- Photonics Research
- Vol. 9, Issue 10, 1958 (2021)
![(a) Schematic of an FP imaging system. Time-sequential illumination from different angles is provided by an illumination array. Each LED shifts a unique part of the sample’s Fourier spectrum [shown by circles in (b)] into the imaging lens, producing corresponding bandpass-filtered sample images [example images in (d)]. The three LEDs are chosen as examples in (a), (b), (d), and (e) with a common color scheme. (c) Both operating modes of SPAD array cameras can generate binary images. (d) Experimental FP data and reconstructions using 12-bit image data. (e) Quantized FP performed with binary image measurements provides reconstruction image quality closely matching 12-bit data in (d).](/richHtml/prj/2021/9/10/10001958/img_001.jpg)
Fig. 1. (a) Schematic of an FP imaging system. Time-sequential illumination from different angles is provided by an illumination array. Each LED shifts a unique part of the sample’s Fourier spectrum [shown by circles in (b)] into the imaging lens, producing corresponding bandpass-filtered sample images [example images in (d)]. The three LEDs are chosen as examples in (a), (b), (d), and (e) with a common color scheme. (c) Both operating modes of SPAD array cameras can generate binary images. (d) Experimental FP data and reconstructions using 12-bit image data. (e) Quantized FP performed with binary image measurements provides reconstruction image quality closely matching 12-bit data in (d).
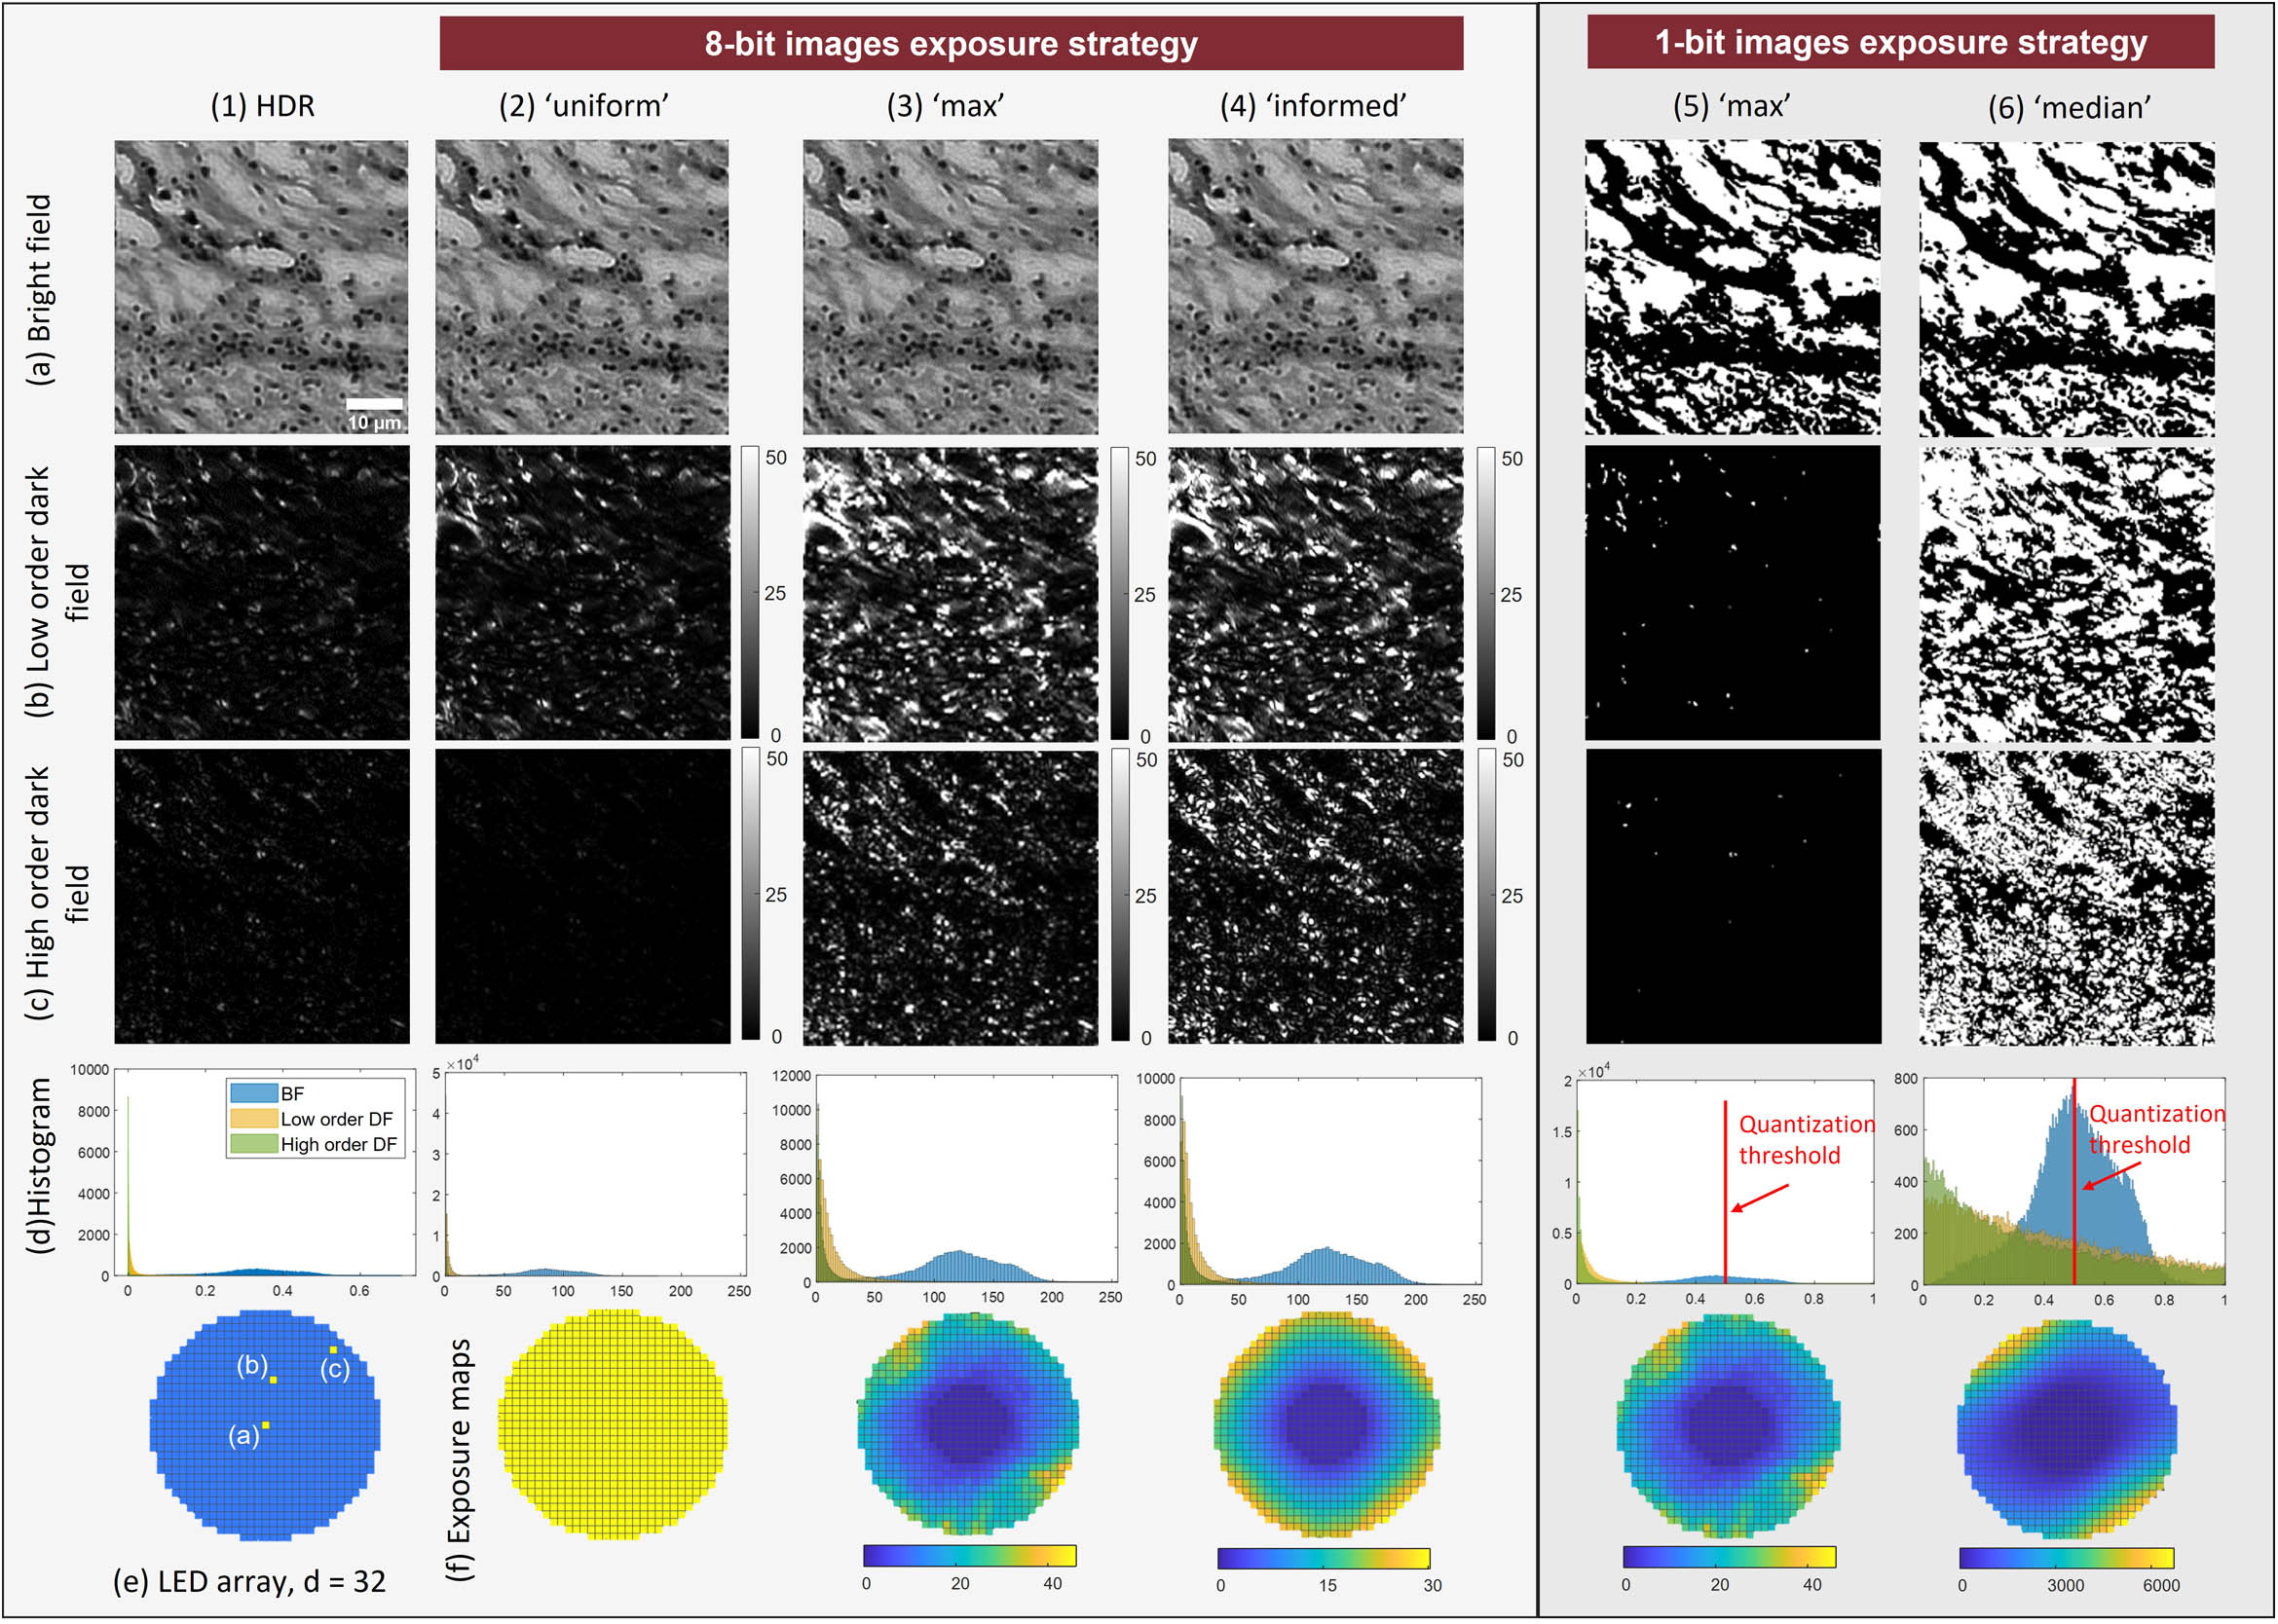
Fig. 2. Example images from a simulation dataset demonstrating four exposure strategies considered in this work based on 32 by 32 LED array. LED positions for selected images (a), (b), (c) are shown in (e). The full high-dynamic-range nature of the dataset can be observed in (1). In (2), uniform exposure method results in most of the image pixel values rounding to zero due to quantization. In (3) and (4), max and informed methods use exposures that are dependent on the sample’s frequency spectrum distribution, leading to low quantization error. (5) Max or informed methods are not sufficient when the extreme case of binary is considered, in which case (6) the median method is chosen.
Fig. 3. Flowchart of the proposed quantized FP reconstruction algorithm. Each step is detailed in Section 2.C .
Fig. 4. Simulation results with quantized FP reconstruction algorithm. (a) Test targets used to assess reconstruction performance with 8-bit imaging (left) and binary 1-bit imaging (right). (b) Example natural scene with unique amplitude and phase. For all cases, reconstruction of high-resolution amplitude and phase from binary image measurements closely matches that from 8-bit image measurement, despite significant decrease in detected information.
Fig. 5. NMSE performance of quantized FP algorithm as a function of raw image bit depth, evaluated using a pathology dataset consisting of 30 unique samples. Each point in plots (a) and (b) is average NMSE across all 30 samples. An example low-resolution image and reconstruction pair is shown for 1-, 2-, 3-, and 8-bit raw image datasets captured with the max illumination strategy.
Fig. 6. Simulation results comparing the influence of FP overlap ratio on reconstruction quality using the max exposure strategy. Each point in the plot is the average NMSE of 12 different samples. (a)–(d) on right refer to sampling rate in Fourier space. Brightness of each pixel in k-space refers to the number of measured images it is associated with. Gaps in the sampled frequency coverage exist below approximately 38% overlap.
Fig. 7. Experimental results from an FP setup using a 12-bit CMOS image sensor, whose image data was binarized post-capture before reconstruction. Quantized FP algorithm reconstructions using binarized image data (median exposure model) closely match standard FP reconstructions from 12-bit images.
Fig. 8. Experimental results from the SPAD array camera. Comparison between the standard FP on the HDR dataset and the quantized FP on the binarized dataset with the median exposure strategy is shown for three different samples.
Fig. 9. (a1), (a2) Example raw SPAD array data captured and (b1), (b2) show the denoised versions. (c1) and (c2) shows the SNR for selected bright-field and dark-field images.
|
Table 1. Proposed Quantized FP Reconstruction

Set citation alerts for the article
Please enter your email address
© Copyright 2018-2021 | Chinese Laser Press. All Rights Reserved 沪ICP备15018463号-20