• High Power Laser Science and Engineering
  • Vol. 6, Issue 4, 04000e53 (2018)
Rao Li1、2、3, Youen Jiang1、2, Zhi Qiao1、2、3, Canhong Huang1、2、3, Wei Fan1、2, Xuechun Li1、2, and Zunqi Lin1、2
Author Affiliations
  • 1National Laboratory on High Power Laser and Physics , Shanghai 201800 , China
  • 2Key Laboratory of High Power Laser and Physics , Shanghai Institute of Optics and Fine Mechanics , Chinese Academy of Sciences , Shanghai 201800 , China
  • 3University of Chinese Academy of Sciences , Beijing 100049 , China
  • show less
    DOI: 10.1017/hpl.2018.48 Cite this Article Set citation alerts
    Rao Li, Youen Jiang, Zhi Qiao, Canhong Huang, Wei Fan, Xuechun Li, Zunqi Lin. Suppression of amplitude modulation induced by polarization mode dispersion using a multi-degree-of-freedom fiber filter[J]. High Power Laser Science and Engineering, 2018, 6(4): 04000e53 Copy Citation Text show less
    Schematic of the polarization-maintaining (PM) front end. DFB laser: distributed feedback laser, AOM: acoustic-optic modulator, Phase Mod: phase modulator, EOM: electro-optic modulator, AWG: arbitrary wave generator, PMF: polarization-maintaining fiber, ILP: inline polarizer. The red pulses present the evolution of temporal profile, which considers the effect of loss, amplification and frequency modulation (FM) to amplitude modulation (AM).
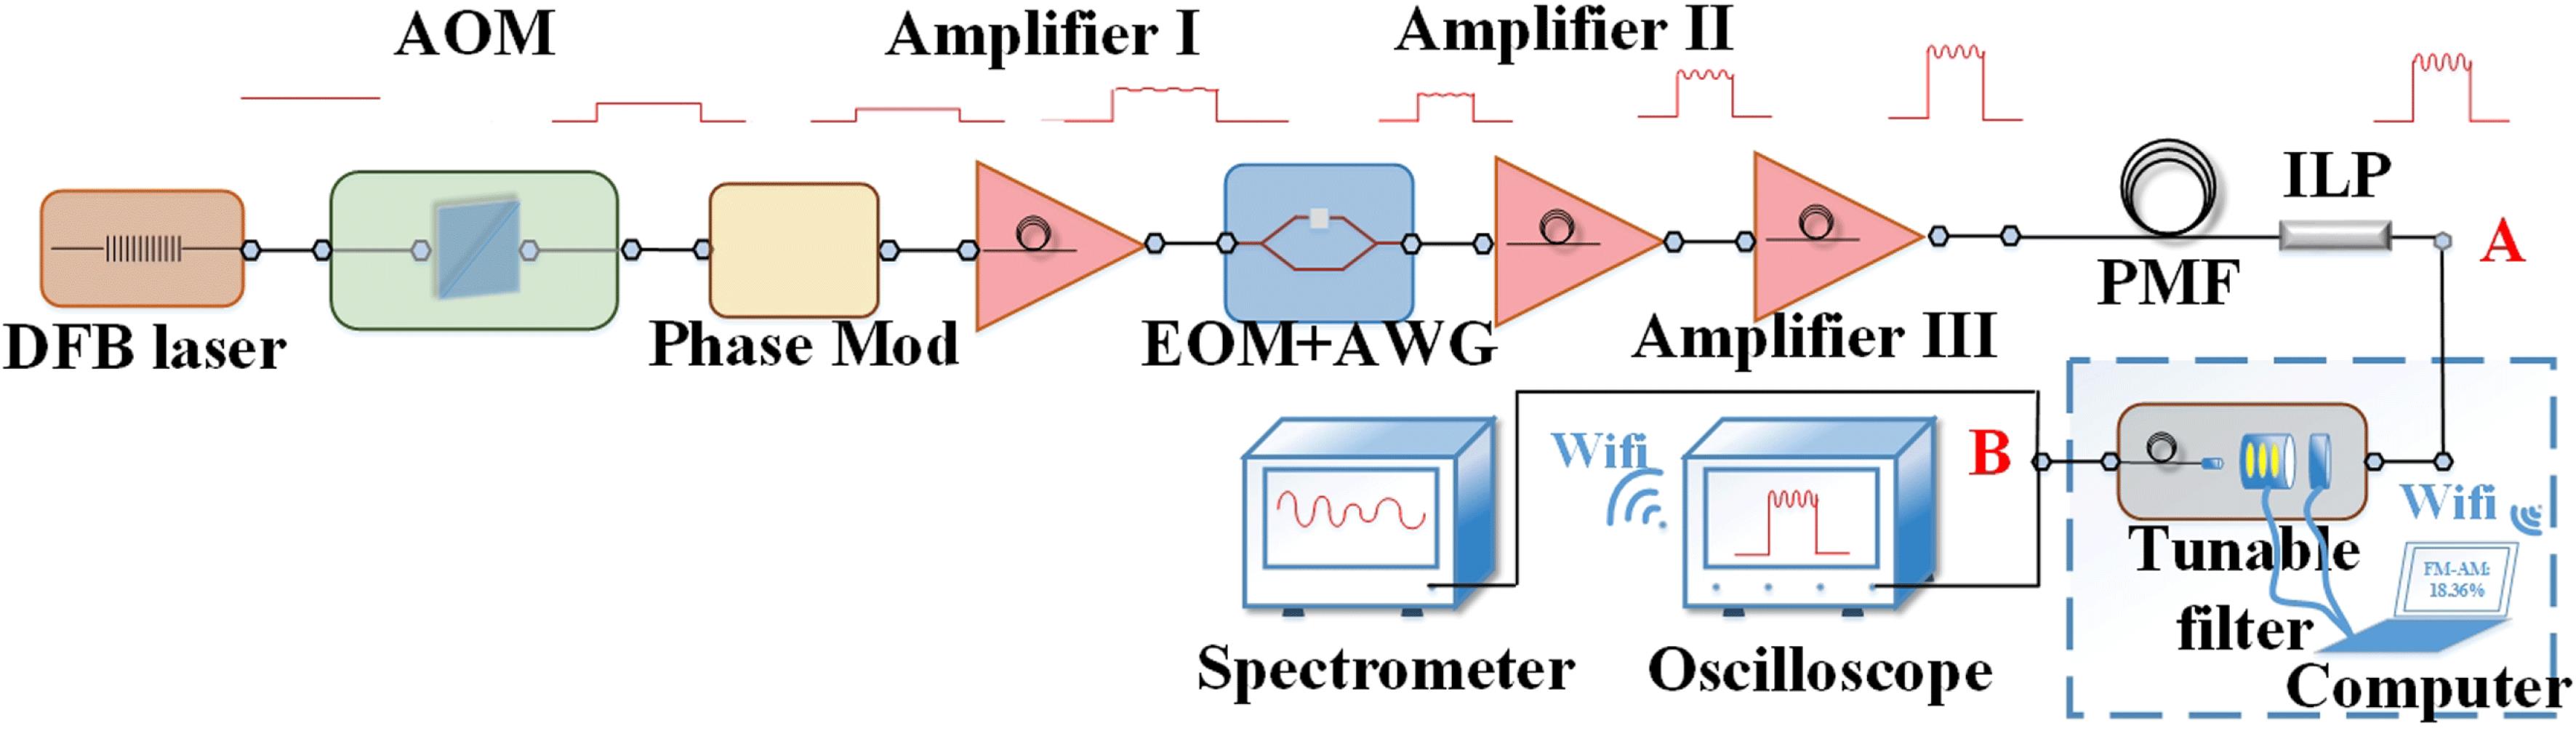
    Fig. 1. Schematic of the polarization-maintaining (PM) front end. DFB laser: distributed feedback laser, AOM: acoustic-optic modulator, Phase Mod: phase modulator, EOM: electro-optic modulator, AWG: arbitrary wave generator, PMF: polarization-maintaining fiber, ILP: inline polarizer. The red pulses present the evolution of temporal profile, which considers the effect of loss, amplification and frequency modulation (FM) to amplitude modulation (AM).
    Transfer functions of (a) one PM patch cord with a 6-m PMF and (b) three connected 1-, 2-, and 10-m PMFs. (c) Schematic of FM-to-AM conversion for a phase-modulated signal (modulation frequency is 22.82 GHz). PER: polarization extinction ratio.
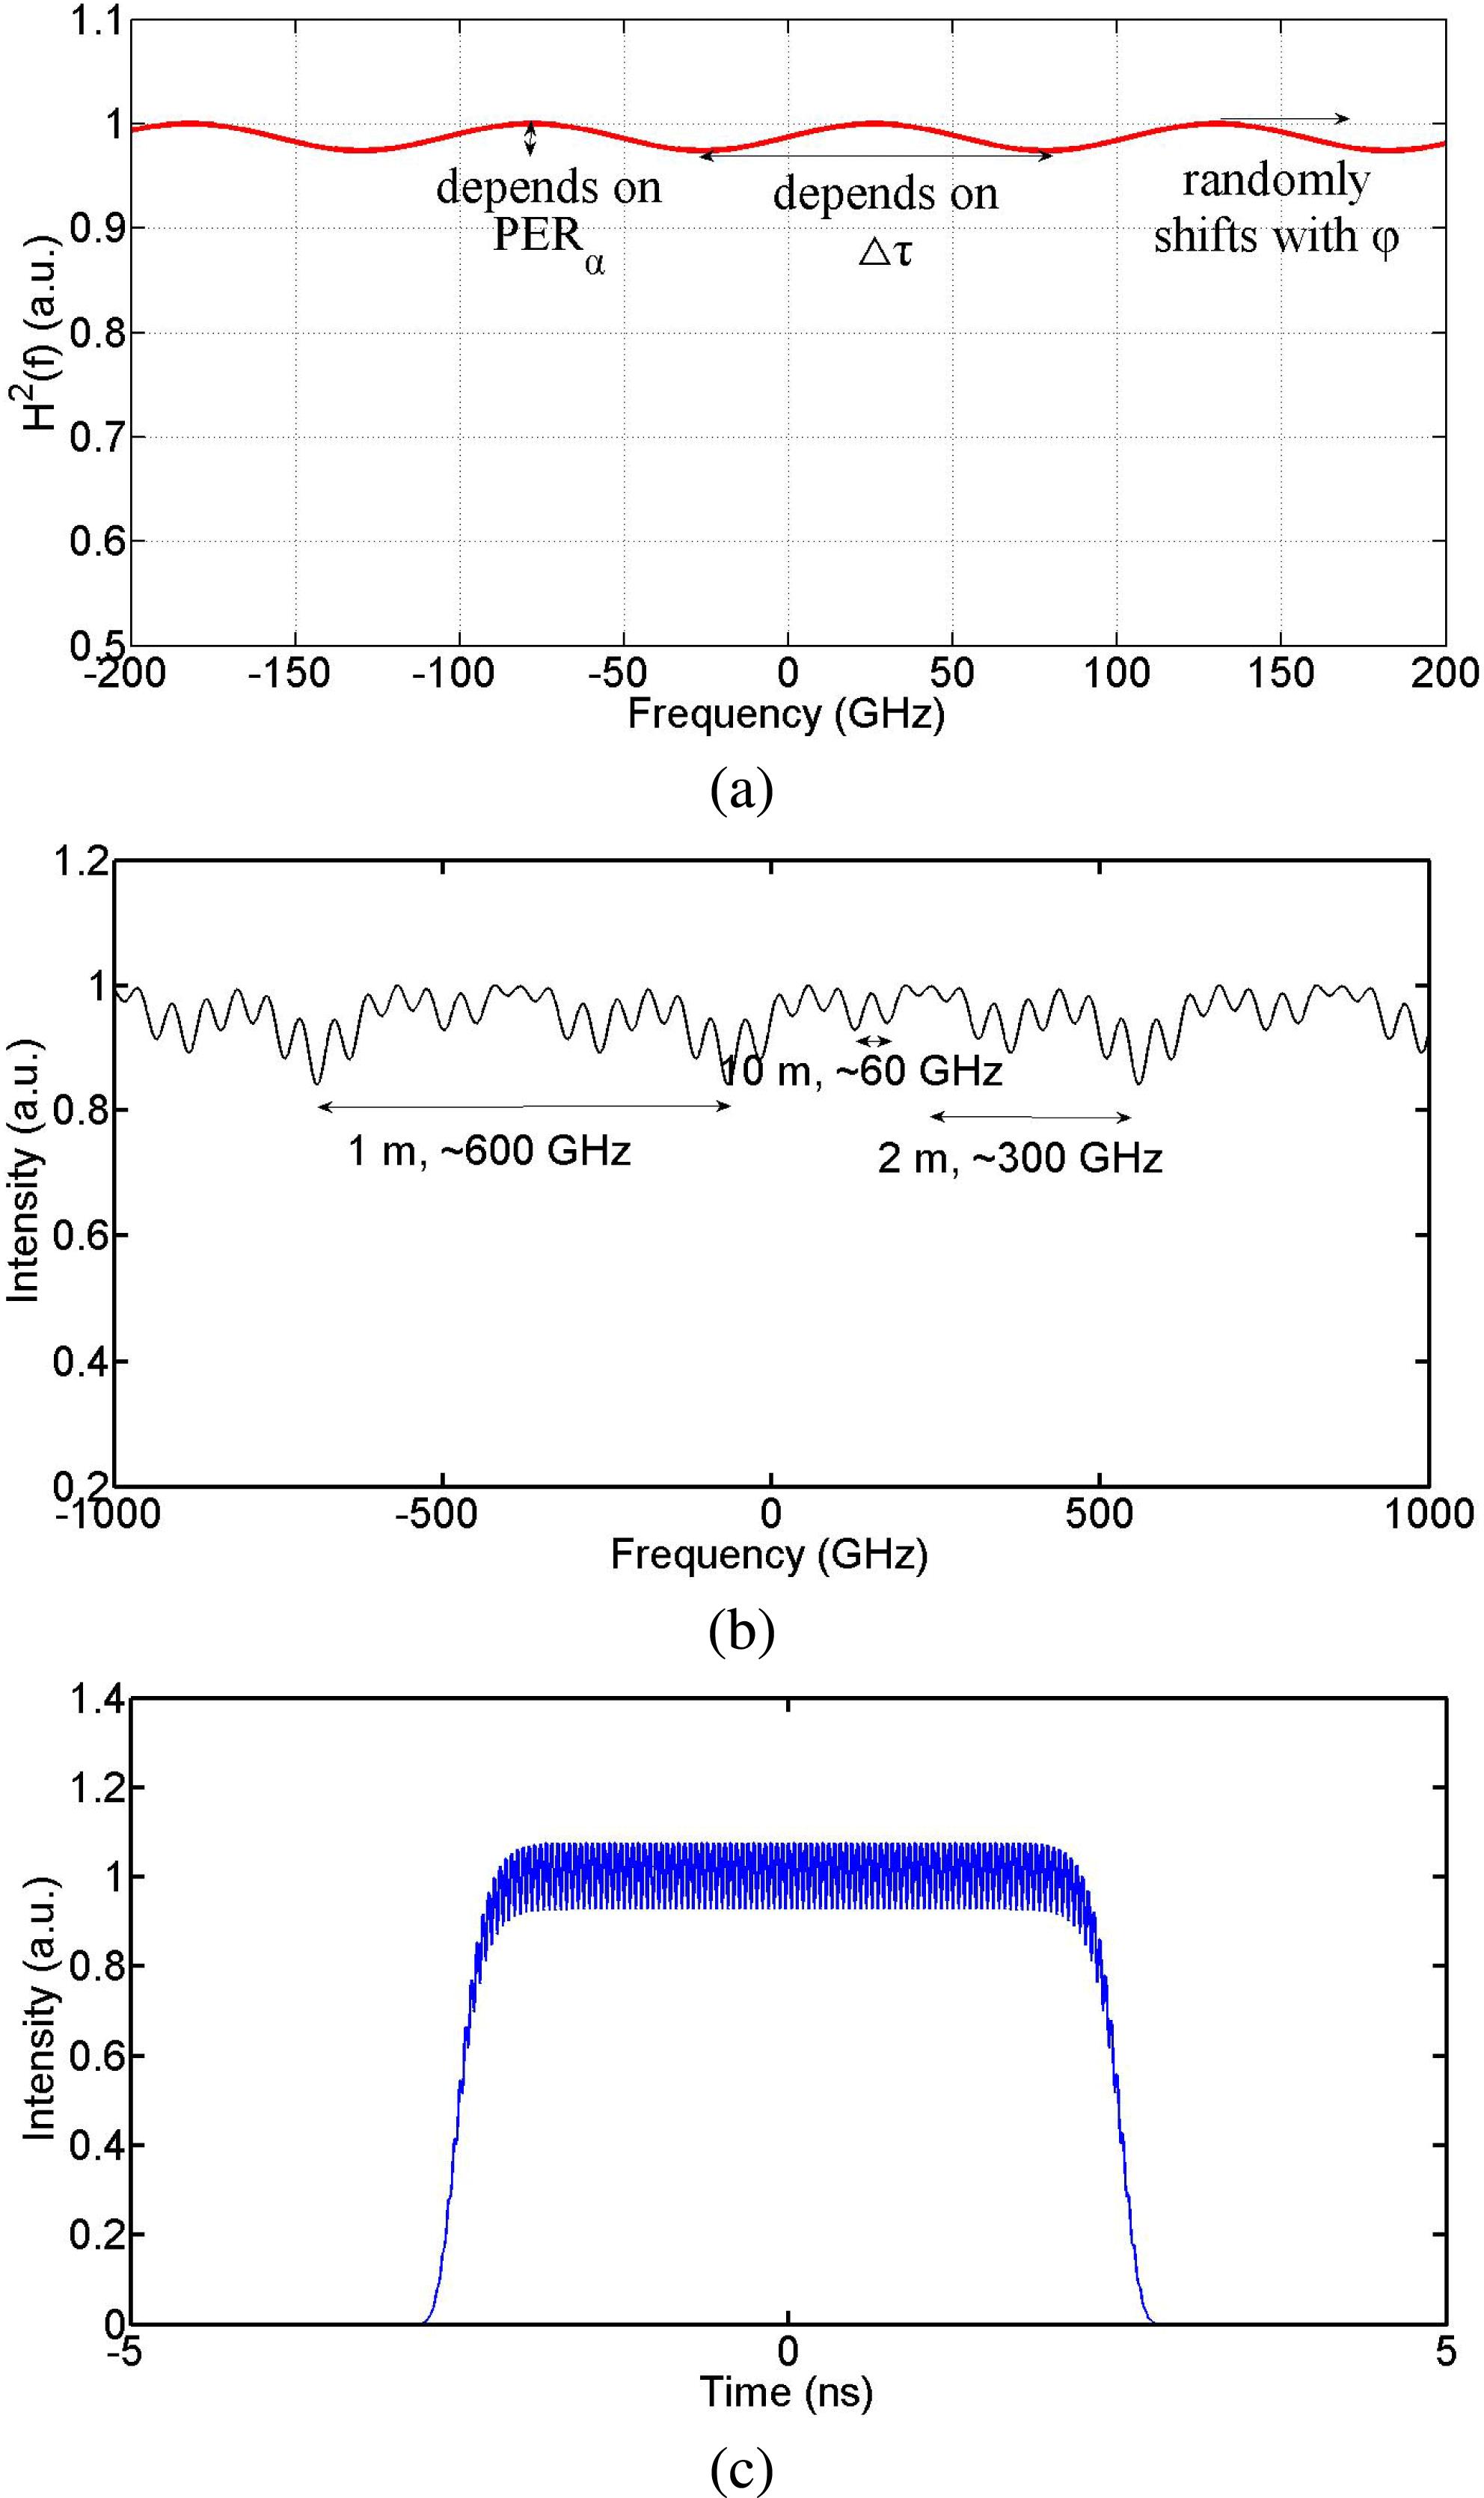
    Fig. 2. Transfer functions of (a) one PM patch cord with a 6-m PMF and (b) three connected 1-, 2-, and 10-m PMFs. (c) Schematic of FM-to-AM conversion for a phase-modulated signal (modulation frequency is 22.82 GHz). PER: polarization extinction ratio.
    Transmission spectra of the front end measured at three different instants of time for randomly varying pressure applied to the PMF in the front end, corresponding to the distortion criteria of 34%, 12.5%, and 18.4%. The inset shows the phase-modulated spectrum of the signal. The red rectangular region indicates the wavelength range containing most of the signal power.
    Fig. 3. Transmission spectra of the front end measured at three different instants of time for randomly varying pressure applied to the PMF in the front end, corresponding to the distortion criteria of 34%, 12.5%, and 18.4%. The inset shows the phase-modulated spectrum of the signal. The red rectangular region indicates the wavelength range containing most of the signal power.
    Schematic of a multi-degrees of freedom (DOF) filter (the blue arrows represent the practical polarization state of the laser, and the red arrows represent the optical axes of the elements). PZF: polarizing fiber, NLC: nematic liquid crystal, PMF: polarization-maintaining fiber, ILP: inline polarizer.
    Fig. 4. Schematic of a multi-degrees of freedom (DOF) filter (the blue arrows represent the practical polarization state of the laser, and the red arrows represent the optical axes of the elements). PZF: polarizing fiber, NLC: nematic liquid crystal, PMF: polarization-maintaining fiber, ILP: inline polarizer.
    Variation of the transfer spectrum with rotation of the half-wave plate. The yellow and purple solid lines correspond to the maximum and minimum modulation and$\unicode[STIX]{x1D70C}=0^{\circ }$and$50^{\circ }$, respectively, while the other solid lines correspond to$\unicode[STIX]{x1D70C}=5^{\circ },10^{\circ },\ldots ,45^{\circ }$. The auxiliary fiber length is 3 m.
    Fig. 5. Variation of the transfer spectrum with rotation of the half-wave plate. The yellow and purple solid lines correspond to the maximum and minimum modulation and $\unicode[STIX]{x1D70C}=0^{\circ }$ and $50^{\circ }$ , respectively, while the other solid lines correspond to $\unicode[STIX]{x1D70C}=5^{\circ },10^{\circ },\ldots ,45^{\circ }$ . The auxiliary fiber length is 3 m.
    FSRs for various lengths of the auxiliary fiber. Plots (a)–(d) correspond to auxiliary fiber lengths of 0, 1.5, 3, and 5 m, respectively. The dashed lines represent the experimental results. The solid lines are obtained by shifting the dashed lines for better observation and comparison on the FSR variation.
    Fig. 6. FSRs for various lengths of the auxiliary fiber. Plots (a)–(d) correspond to auxiliary fiber lengths of 0, 1.5, 3, and 5 m, respectively. The dashed lines represent the experimental results. The solid lines are obtained by shifting the dashed lines for better observation and comparison on the FSR variation.
    (a) Transfer spectra of the filter at different driving voltages. (b) Dependence of the peak wavelength (triangles) and peak power (black line) on the NLC voltage. The inset shows the retardance performance of the NLC. (c) Wavelength change with the phase retardance of the NLC. The auxiliary fiber length is 0 m.
    Fig. 7. (a) Transfer spectra of the filter at different driving voltages. (b) Dependence of the peak wavelength (triangles) and peak power (black line) on the NLC voltage. The inset shows the retardance performance of the NLC. (c) Wavelength change with the phase retardance of the NLC. The auxiliary fiber length is 0 m.
    (a) Transmission spectra before (black line) and after (blue line) compensation. The green dashed line indicates the big-scale envelope which has the main effect on the FM-to-AM conversion. The numbers represent the transmittance values for each spectral line. (b) Temporal profiles of the output pulses before ($\unicode[STIX]{x1D6FC}\approx 18\%$) and after ($\unicode[STIX]{x1D6FC}\approx 3.2\%$) compensation.
    Fig. 8. (a) Transmission spectra before (black line) and after (blue line) compensation. The green dashed line indicates the big-scale envelope which has the main effect on the FM-to-AM conversion. The numbers represent the transmittance values for each spectral line. (b) Temporal profiles of the output pulses before ( $\unicode[STIX]{x1D6FC}\approx 18\%$ ) and after ( $\unicode[STIX]{x1D6FC}\approx 3.2\%$ ) compensation.
    FM-to-AM conversion before and after compensation monitored for 3 h.
    Fig. 9. FM-to-AM conversion before and after compensation monitored for 3 h.
    $\unicode[STIX]{x1D70C}$ (deg)051015202530354045505560657075808590
    ModulationExperiment13.812.911.710.19.767.335.994.623.412.151.560.31.82.353.85.16.357.69.96
    depth (dB)Simulation1715131196.74.83.21.501.53.24.86.7911131517
    Table 1. Evolution of modulation depth of the filter vs. rotation angle $\unicode[STIX]{x1D70C}$ .
    Rao Li, Youen Jiang, Zhi Qiao, Canhong Huang, Wei Fan, Xuechun Li, Zunqi Lin. Suppression of amplitude modulation induced by polarization mode dispersion using a multi-degree-of-freedom fiber filter[J]. High Power Laser Science and Engineering, 2018, 6(4): 04000e53
    Download Citation