
Juan Liu, Qian Du, Fangning Liu, Ke Wang, Jiayi Yu, Dongmei Wei. Vortex Beam Phase Correction Based on Deep Phase Estimation Network[J]. Acta Optica Sinica, 2023, 43(6): 0601013
- Acta Optica Sinica
- Vol. 43, Issue 6, 0601013 (2023)
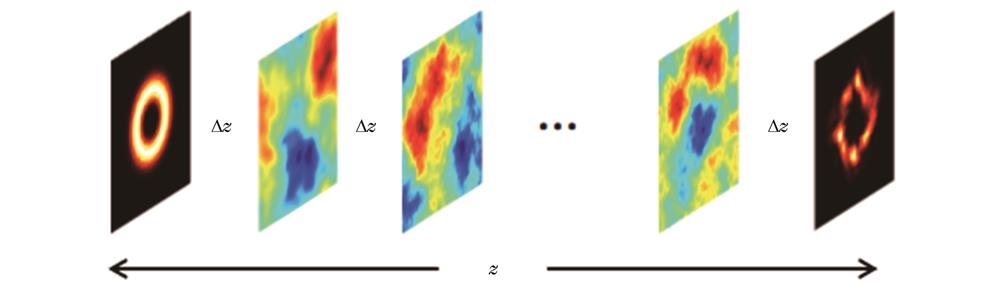
Fig. 1. Schematic diagram of beam transmission through multiple phase screens
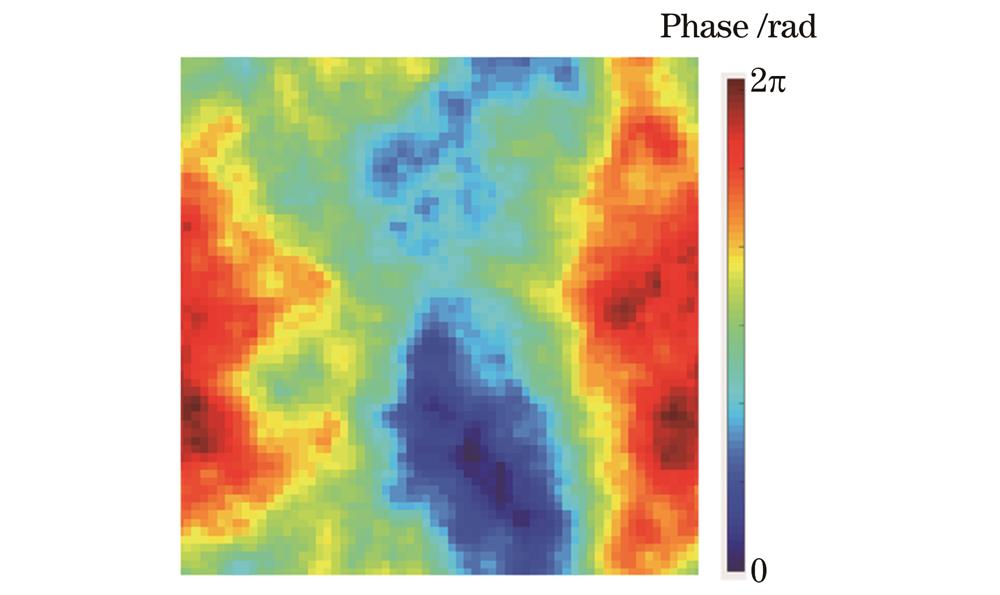
Fig. 2. Simulated phase diagram
Fig. 3. Influence of atmospheric turbulence on beam transmission
Fig. 4. Mode purity of LG (l=5) under different turbulence intensities
Fig. 5. Block diagrams of phase compensation process. (a) Source pre-compensation; (b) direct compensation at receiving end
Fig. 6. DPEnet network structure
Fig. 7. Simulated and predicted phase screens with different turbulence intensities. (a)
Fig. 8. Compensation results. (a) Intensity profile in source plane; uncompensated and compensated intensity profiles with turbulence intensities of (b)
Fig. 9. Mode purity before and after compensation
Fig. 10. Phases before and after compensation. (a) Phase in source plane; uncompensated and compensated phases with turbulence intensities of (b)
|
Table 1. Database
|
Table 2. Comparison of MSE between predicted phase screen and simulated phase screen
|
Table 3. Comparison of MSE of intensity profiles before and after compensation

Set citation alerts for the article
Please enter your email address
© Copyright 2018-2021 | Chinese Laser Press. All Rights Reserved 沪ICP备15018463号-20