• Acta Optica Sinica
  • Vol. 40, Issue 12, 1230001 (2020)
Xi Yang1、**, Pengshuai Sun2, Tao Pang2, Hua Xia2, Bian Wu2, Qiming Xu3, Zhirong Zhang1、2、4、5、*, and Zhifeng Shu6
Author Affiliations
  • 1School of Environment Science and Optoelectronic Technology, University of Science and Technology of China, Hefei, Anhui 230026, China
  • 2Key Lab of Environmental Optics & Technology, Anhui Institute of Optics and Fine Mechanics, Chinese Academy of Sciences, Hefei, Anhui 230031, China;
  • 3Department of Safety Health and Environmental Engineering, Yunlin University of Science and Technology, Yunlin, Taiwan 64002, China
  • 4Anhui Provincial Key Laboratory of Photonic Devices and Materials, Anhui Institute of Optics and Fine Mechanics, Chinese Academy of Sciences, Hefei, Anhui 230031, China
  • 5Advanced Laser Technology Laboratory of Anhui Province, Heifei, Anhui 230037, China
  • 6School of Physics and Materials Engineering, Heifei Normal University, Heifei, Anhui 230601, China
  • show less
    DOI: 10.3788/AOS202040.1230001 Cite this Article Set citation alerts
    Xi Yang, Pengshuai Sun, Tao Pang, Hua Xia, Bian Wu, Qiming Xu, Zhirong Zhang, Zhifeng Shu. High Precision Temperature Control Design of Gas Cell in Laser Absorption Spectroscopy System[J]. Acta Optica Sinica, 2020, 40(12): 1230001 Copy Citation Text show less
    Internal structural diagram of temperature control box
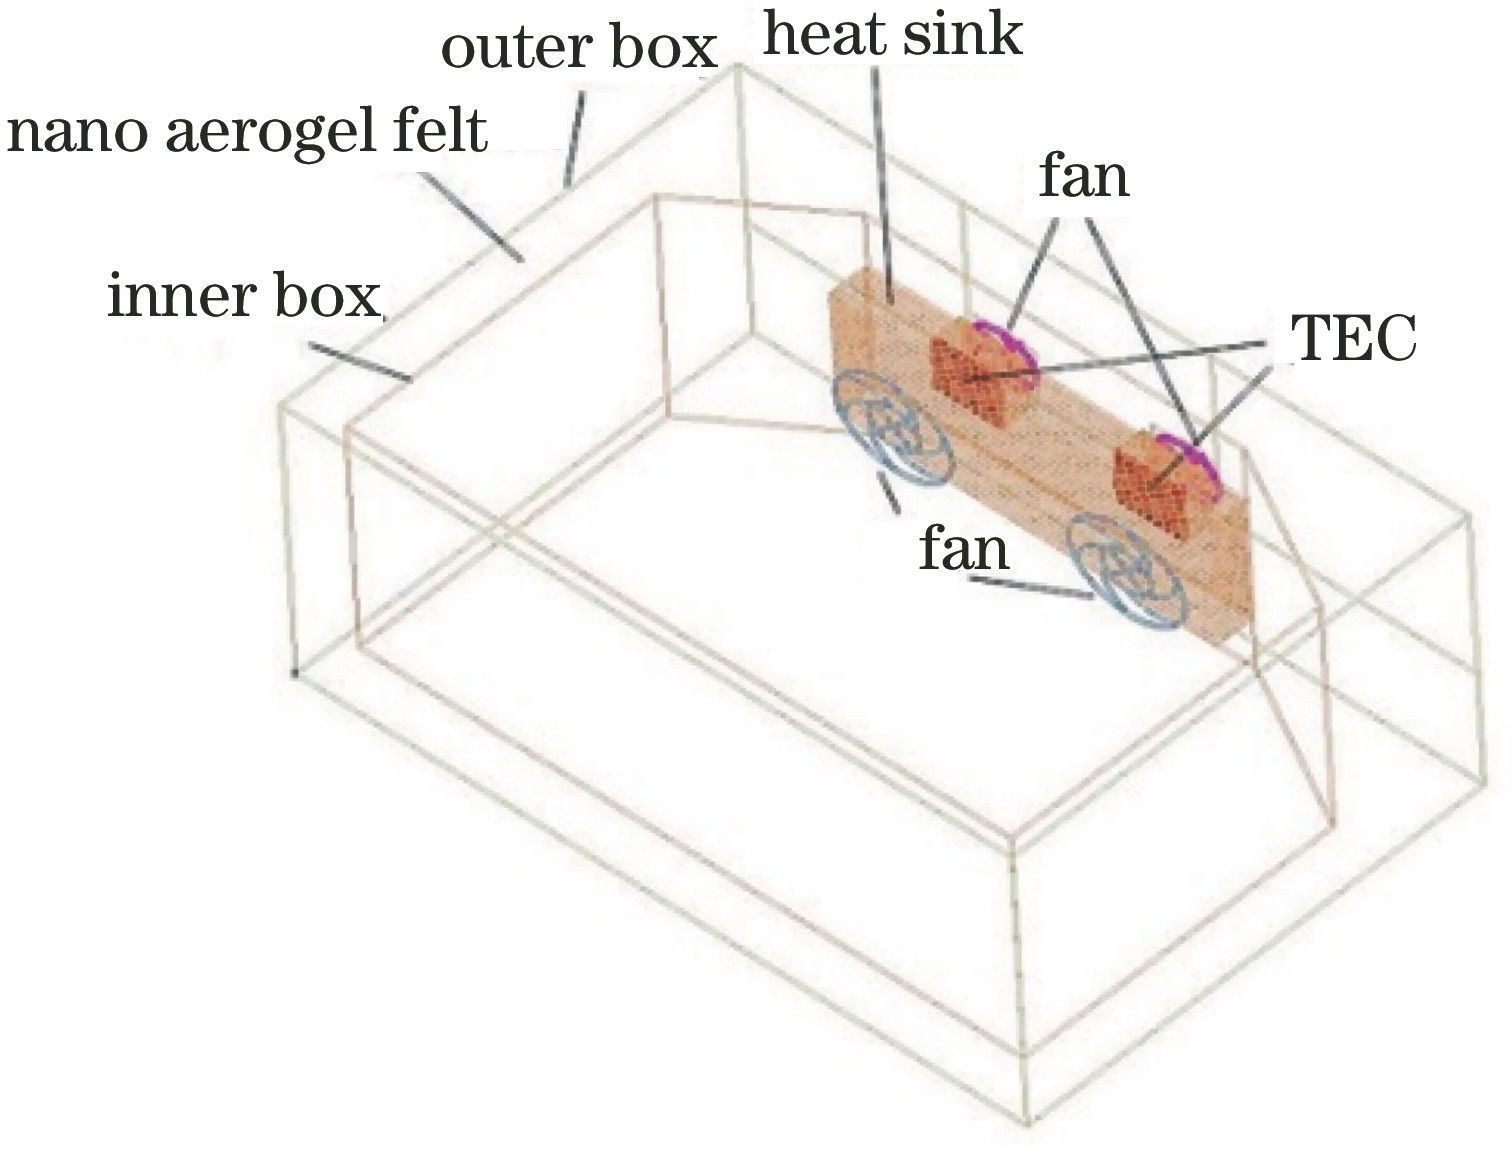
    Fig. 1. Internal structural diagram of temperature control box
    Temperature simulation results without fan
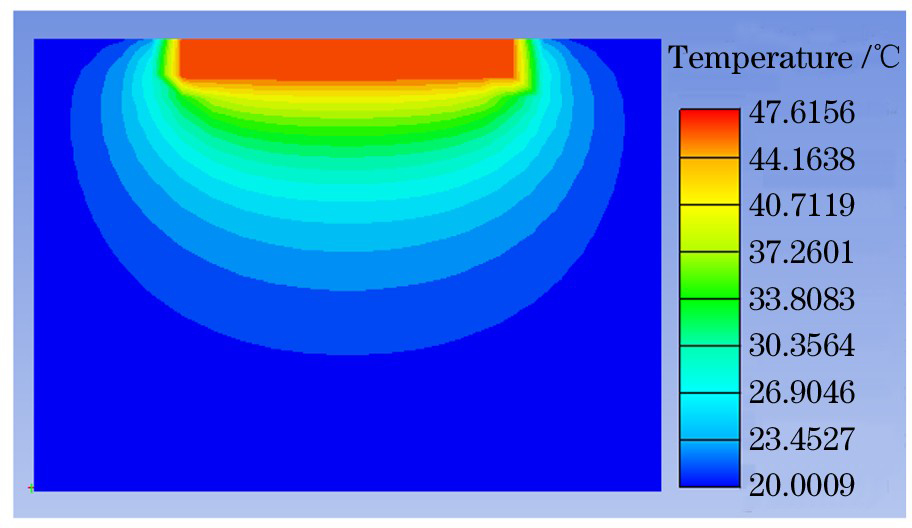
    Fig. 2. Temperature simulation results without fan
    Fan wind direction
    Fig. 3. Fan wind direction
    Simulation results for wind direction 1. (a) Temperature ; (b) flow-field
    Fig. 4. Simulation results for wind direction 1. (a) Temperature ; (b) flow-field
    Simulation results for wind direction 2. (a) Temperature; (b) flow-field
    Fig. 5. Simulation results for wind direction 2. (a) Temperature; (b) flow-field
    Simulation results for wind direction 2 with box chamfer. (a) Temperature; (b) flow-field
    Fig. 6. Simulation results for wind direction 2 with box chamfer. (a) Temperature; (b) flow-field
    Seven temperature recording points
    Fig. 7. Seven temperature recording points
    Recording point temperatures under different heat transfer coefficients
    Fig. 8. Recording point temperatures under different heat transfer coefficients
    Real picture of temperature control box
    Fig. 9. Real picture of temperature control box
    Schematic of TDLAS gas detection temperature control experimental system
    Fig. 10. Schematic of TDLAS gas detection temperature control experimental system
    Temperature curves in temperature control box within one hour under different setting temperatures. (a) 36 ℃; (b) 38 ℃; (c) 40 ℃; (d) 42 ℃
    Fig. 11. Temperature curves in temperature control box within one hour under different setting temperatures. (a) 36 ℃; (b) 38 ℃; (c) 40 ℃; (d) 42 ℃
    Second harmonic signal
    Fig. 12. Second harmonic signal
    CO2 concentration at room temperature and change of room temperature. (a) CO2 concentration at room temperature; (b) room temperature
    Fig. 13. CO2 concentration at room temperature and change of room temperature. (a) CO2 concentration at room temperature; (b) room temperature
    CO2 concentrations under different temperatures. (a) 36 ℃; (b) 40 ℃
    Fig. 14. CO2 concentrations under different temperatures. (a) 36 ℃; (b) 40 ℃
    Xi Yang, Pengshuai Sun, Tao Pang, Hua Xia, Bian Wu, Qiming Xu, Zhirong Zhang, Zhifeng Shu. High Precision Temperature Control Design of Gas Cell in Laser Absorption Spectroscopy System[J]. Acta Optica Sinica, 2020, 40(12): 1230001
    Download Citation