• Journal of Radiation Research and Radiation Processing
  • Vol. 41, Issue 1, 010302 (2023)
Yichen SUN1, Dan DU1、2, Jing LI1, and Jiajin LIN1、*
Author Affiliations
  • 1Department of Radiation Biology, Faculty of Preventive Medicine, Air Force Medical University, Xi’an 710032, China
  • 2School of Public Health, Shaanxi University of Chinese Medicine, Xianyang 712000, China
  • show less
    DOI: 10.11889/j.1000-3436.2022-0115 Cite this Article
    Yichen SUN, Dan DU, Jing LI, Jiajin LIN. Variations and uncertainty in electromagnetic dose caused by weight differences of experimental animals[J]. Journal of Radiation Research and Radiation Processing, 2023, 41(1): 010302 Copy Citation Text show less
    Dose simulation environment
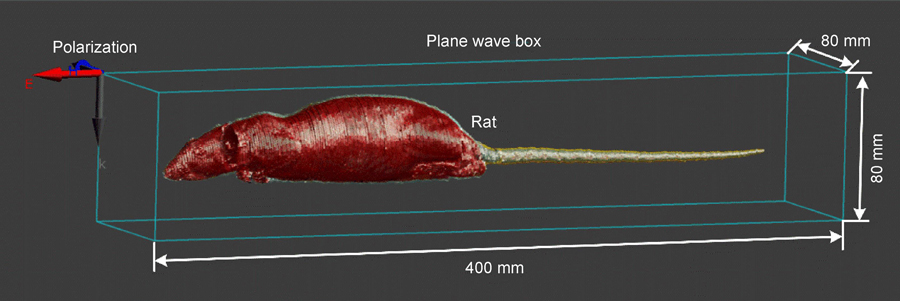
    Fig. 1. Dose simulation environment
    Relationship between WBASAR value and body weight: (a) 0.1 GHz; (b) 0.5 GHz; (c) 1 GHz; (d) 2 GHz; (e) 3 GHz; (f) 4 GHz; (g) 5 GHz; (h) 6 GHz
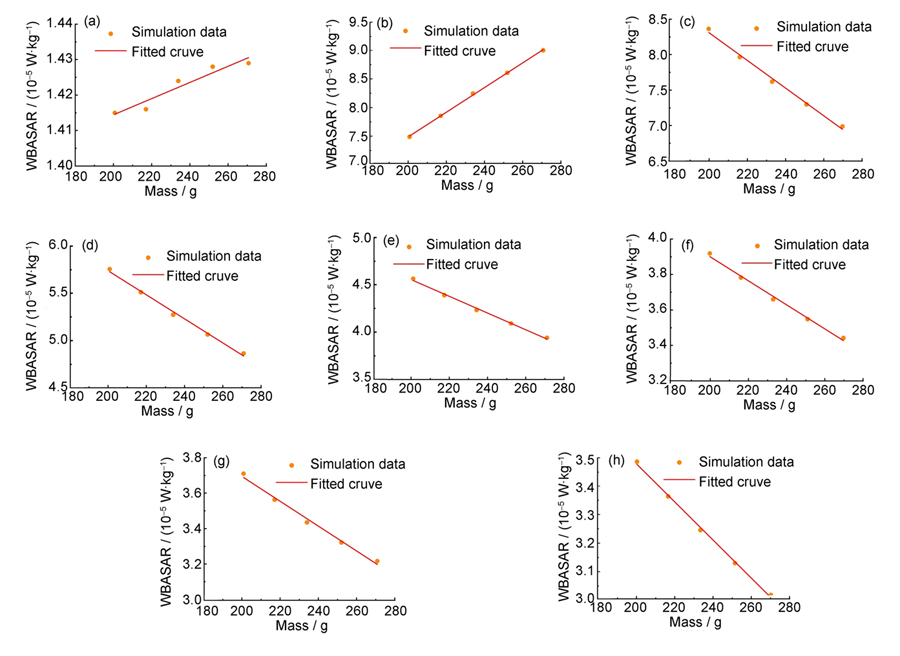
    Fig. 2. Relationship between WBASAR value and body weight: (a) 0.1 GHz; (b) 0.5 GHz; (c) 1 GHz; (d) 2 GHz; (e) 3 GHz; (f) 4 GHz; (g) 5 GHz; (h) 6 GHz
    Flow chart of general simulation evaluation
    Fig. 3. Flow chart of general simulation evaluation
    Flow chart of fitting calculation evaluation
    Fig. 4. Flow chart of fitting calculation evaluation

    序号

    No.

    缩放系数

    Scaling coefficient

    体重 / g

    Body weight

    体长 / mm

    Body length

    10.950200.7175.8
    20.975217.0180.5
    31.000233.9185.0
    41.025251.9189.6
    51.050270.7194.3
    Table 1. Relationship between body weight, body length and scaling coefficient

    体重 / g

    Body weight

    WBASAR值 / (W‧kg-1)

    WBASAR value

    0.1 GHz0.5 GHz1 GHz2 GHz3 GHz4 GHz5 GHz6 GHz
    200.71.42×10-57.47×10-58.36×10-55.75×10-54.56×10-53.92×10-53.71×10-53.48×10⁻⁵
    217.01.42×10-57.84×10-57.97×10-55.51×10-54.39×10-53.78×10-53.57×10-53.36×10⁻⁵
    233.91.42×10-58.23×10-57.62×10-55.27×10-54.23×10-53.66×10-53.44×10-53.24×10⁻⁵
    251.91.43×10-58.59×10-57.30×10-55.06×10-54.09×10-53.55×10-53.33×10-53.13×10⁻⁵
    270.71.43×10-58.99×10-56.99×10-54.86×10-53.94×10-53.44×10-53.22×10-53.01×10⁻⁵
    Table 2. WBASAR of rats of different weight at 0.1~6 GHz

    频率 / GHz

    Frequency

    截距 / (W·kg-1) Intercept斜率 / (W‧kg-1·g-1) Slope

    拟合度

    Degree of fitting

    数值 Value标准差 Standard error数值 Value标准差 Standard error
    0.11.37×10-59.31×10-82.28×10-93.94×10-100.890
    0.53.13×10-58.17×10-72.17×10-73.46×10-90.999
    11.22×10-52.13×10-6-1.95×10-79.04×10-90.991
    28.28×10-51.29×10-6-1.27×10-75.47×10-90.993
    36.32×10-57.60×10-7-8.83×10-83.22×10-90.995
    45.26×10-57.49×10-7-6.77×10-83.17×10-90.991
    55.10×10-59.37×10-7-7.00×10-83.97×10-90.987
    64.82×10-54.21×10-7-6.70×10-81.78×10-90.997
    Table 3. Specific absorption rate of animals exposed in different directions

    序号

    No.

    体重 / g

    Body weight

    WBASAR值 / (W‧kg-1)

    WBASAR value

    1212.41.88×10-1
    2257.21.70×10-1
    3223.81.83×10-1
    4227.61.81×10-1
    5246.51.74×10-1
    6244.71.75×10-1
    7241.21.76×10-1
    8217.91.85×10-1
    9261.91.69×10-1
    10245.41.75×10-1
    11221.41.84×10-1
    12213.31.87×10-1
    Table 4. Dose data of single calculation method
    原始体重 Original weight拟合值 Fitted value拟合评估 Fitting evaluation

    均值 / g

    Mean value

    标准差 / g

    Standard

    deviation

    离散系数

    Discrete

    coefficient

    斜率

    / (W‧kg-1·g-1)

    Slope

    截距

    / (W‧kg-1)

    Intercept

    拟合度

    Degree of

    fitting

    均值

    / (W‧kg-1)

    Mean

    value

    标准差

    / (W‧kg-1)

    Standard

    deviation

    离散系数

    Discrete

    cofficient

    234.416.46.99×10-2-3.96×10-42.72×10-19.95×10-11.79×10-16.50×10-33.62×10-2
    Table 5. Basic data of fitting recurrence method
    Yichen SUN, Dan DU, Jing LI, Jiajin LIN. Variations and uncertainty in electromagnetic dose caused by weight differences of experimental animals[J]. Journal of Radiation Research and Radiation Processing, 2023, 41(1): 010302
    Download Citation