
Bo LI, Ya-zhou PU, Nan WANG, Yu-feng WANG, Hui-ge DI, Yue-hui SONG, Deng-xin HUA. A Method for Assimilating the Raman Lidar Detecting Temperature in WRF on Simulating the Short-Time Heavy Rainfall[J]. Spectroscopy and Spectral Analysis, 2021, 41(7): 2110
- Spectroscopy and Spectral Analysis
- Vol. 41, Issue 7, 2110 (2021)
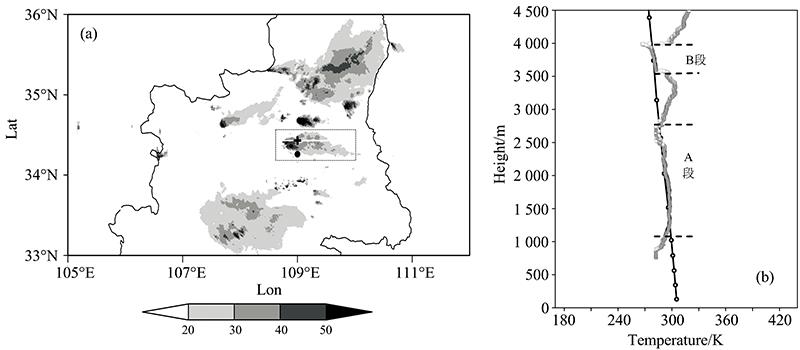
Fig. 1. (a) The microwave radar echo (shaded, unit: dBz) at 1200 UTC 20 July 2015, the black cross represents the location of the microwave radar, the dashed pane is the convective cloud influenced Xi'an, and the black dot is the location of lidar; (b) The atmospheric temperature profile (densely gray pane) detected by lidar, and the FNL temperature profile (black circle) in Xi'an at 1200 UTC 20 July 2015, unit: K
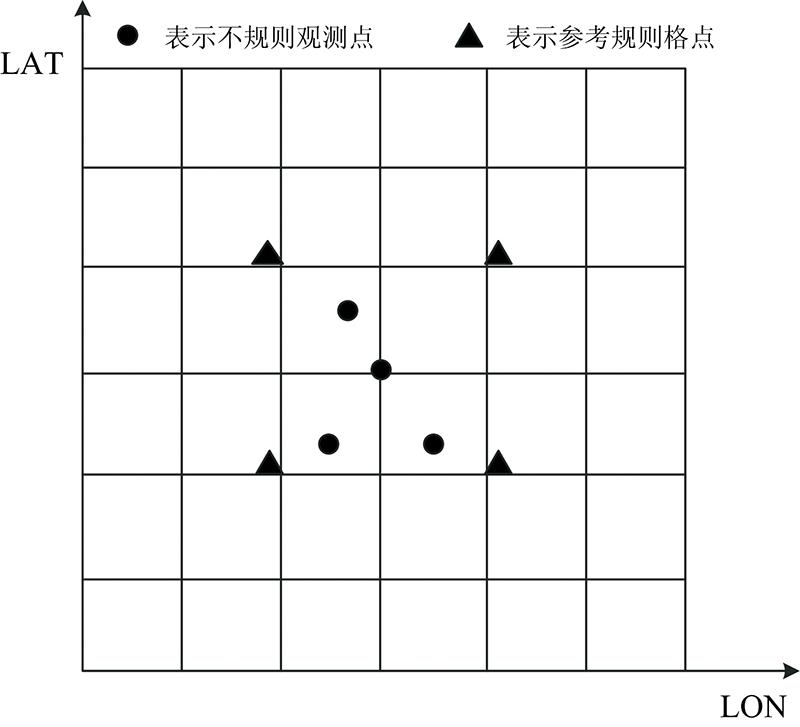
Fig. 2. The detecting points, referencing points, and interpolating points in the MQ method
Fig. 3. Flow chart for the coupling of MQ and WRF
Fig. 4. The relationship between the RMSE and c
(a): 1 530 m; (b): 3 710 m
(a): 1 530 m; (b): 3 710 m
Fig. 5. The temperature distribution on the 49 groups of interpolated grids at 1 530 m (a) and 3 710 m (b)
The black dots represent irregular observations, unit: ℃
The black dots represent irregular observations, unit: ℃
Fig. 6. Qualitative comparison of rainfall during 1200 UTC—1800 UTC 20 July 2015, unit: mm
(a): Observation precipitation; (b): CTRL Simulation precipitation before assimilating; (c): Simulation precipitation after assimilating the ground and sounding data; (d): Simulation precipitation after assimilating the lidar data
(a): Observation precipitation; (b): CTRL Simulation precipitation before assimilating; (c): Simulation precipitation after assimilating the ground and sounding data; (d): Simulation precipitation after assimilating the lidar data
|
Table 1. Quantitative analysis of precipitation before and after data assimilating

Set citation alerts for the article
Please enter your email address
© Copyright 2018-2021 | Chinese Laser Press. All Rights Reserved 沪ICP备15018463号-20