
Ying-fei ZHAN, Chun-guang LIU, Ming-wei WANG, Jian YANG, Han-cheng ZHU, Duan-ting YAN, Chang-shan XU, Yu-xue LIU. Preparation, Microstructure and Optical Properties of Cr3+ Single-Doped and Eu3+/Cr3+ Co-Doped GdAlO3 Near Infrared Long Persistent Luminescent Nanoparticles[J]. Spectroscopy and Spectral Analysis, 2021, 41(1): 80
- Spectroscopy and Spectral Analysis
- Vol. 41, Issue 1, 80 (2021)
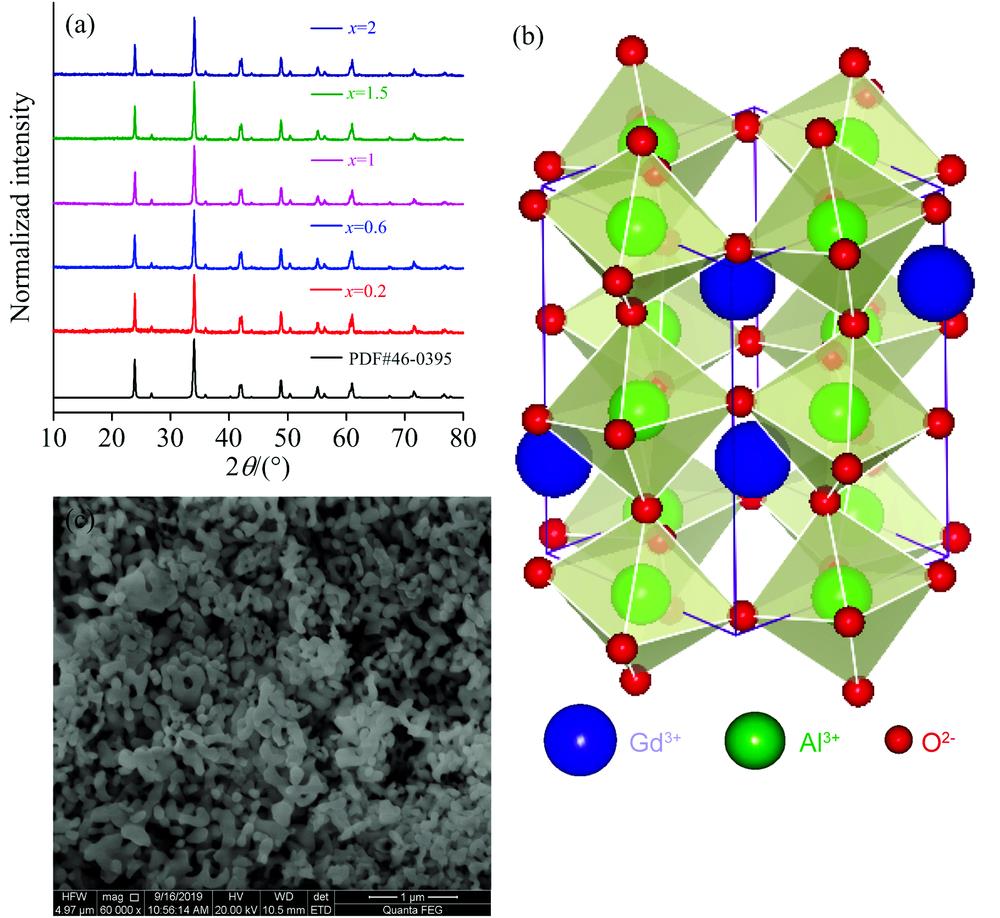
Fig. 1. (a) XRD patterns of GdAlO3:x %Cr3+ (x =0.2, 0.6, 1.0, 1.5, 2.0) powders; (b) A cell of GdAlO3; (c) SEM picture of GdAlO3:1%Cr3+ powders
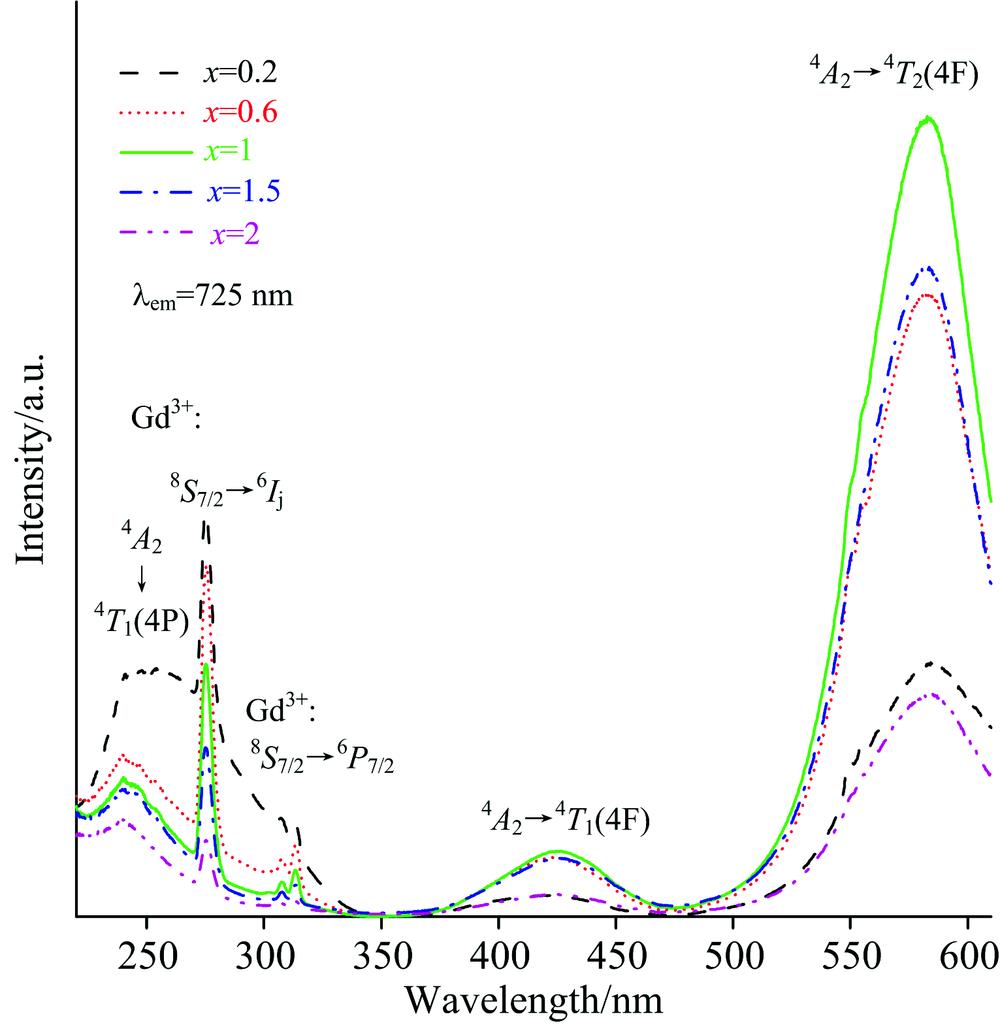
Fig. 2. Excitation spectra (λ em=725 nm) of GdAlO3:x %Cr3+(x =0.2, 0.6, 1.0, 1.5, 2.0) powders
Fig. 3. (a) Emission spectra and (b) normalized emission spectra (λ ex=583 nm) of GdAlO3:x %Cr3+(x =0.2, 0.6, 1.0, 1.5, 2.0 ) powders
Fig. 4. (a) Tanabe-Sugano diagram showing the relationship between energy levels of Cr3+ with 3d 3 electron configuration and the related crystal filed parameter, dotted line shows the position of crystal filed parameter in the case of GdAlO3:Cr3+; (b) Configurational coordinate diagram related to the transition processes between the energy levels of Cr3+ doped in GdAlO3:Cr3+
Fig. 5. Afterglow decay curves of GdAlO3:x %Cr3+(x =0.6, 1.0, 1.5) with different doping concentrations
Fig. 6. XRD patterns of GdAlO3:1%Cr3+, y %Eu3+(y =4, 7, 11, 13, 15, 17) powders with different doping concentrations
Fig. 7. Excitation spectra of (a) GdAlO3:13%Eu3+, (b) GdAlO3:1%Cr3+ and (c)GdAlO3:1%Cr3+, 13%Eu3+ powders
Fig. 8. Emission spectra (λ ex=266 nm) of GdAlO3:1%Cr3+, y %Eu3+(y =4, 7, 11, 13, 15, 17) powders with different doping concentrations. The inset shows emission spectrum of GdAlO3:13%Eu3+ powders
Fig. 9. Afterglow decay curves of GdAlO3:1%Cr3+, y %Eu3+(y =0, 13) powders. The inset shows the afterglow decay curve of GdAlO3:13%Eu3+powders
Fig. 10. SEM photo of GdAlO3:1%Cr3+, 13%Eu3+powders
Fig. 11. The decay curves of GdAlO3:1%Cr3+, y %Eu3+ powders
Fig. 12. Luminescence and energy transfer mechanisms of Eu3+ and Cr3+

Set citation alerts for the article
Please enter your email address
© Copyright 2018-2021 | Chinese Laser Press. All Rights Reserved 沪ICP备15018463号-20