• Spectroscopy and Spectral Analysis
  • Vol. 41, Issue 10, 3069 (2021)
De-fang LUO1、*, Jie PENG1、1; *;, Chun-hui FENG1、1;, Wei-yang LIU1、1;, Wen-jun JI2、2;, and Nan WANG3、3;
Author Affiliations
  • 11. College of Plant Sciences, Tarim University, Alar 843300, China
  • 22. College of Land Resources Management, China Agricultural University, Beijing 100083, China
  • 33. College of Environment and Resources, Zhejiang University, Hangzhou 310058, China
  • show less
    DOI: 10.3964/j.issn.1000-0593(2021)10-3069-08 Cite this Article
    De-fang LUO, Jie PENG, Chun-hui FENG, Wei-yang LIU, Wen-jun JI, Nan WANG. Inversion of Soil Organic Matter Fraction in Southern Xinjiang by Visible-Near-Infrared and Mid-Infrared Spectra[J]. Spectroscopy and Spectral Analysis, 2021, 41(10): 3069 Copy Citation Text show less
    VNIR (a) and MIR (b) reflectance spectra of soil organic matter and fractions
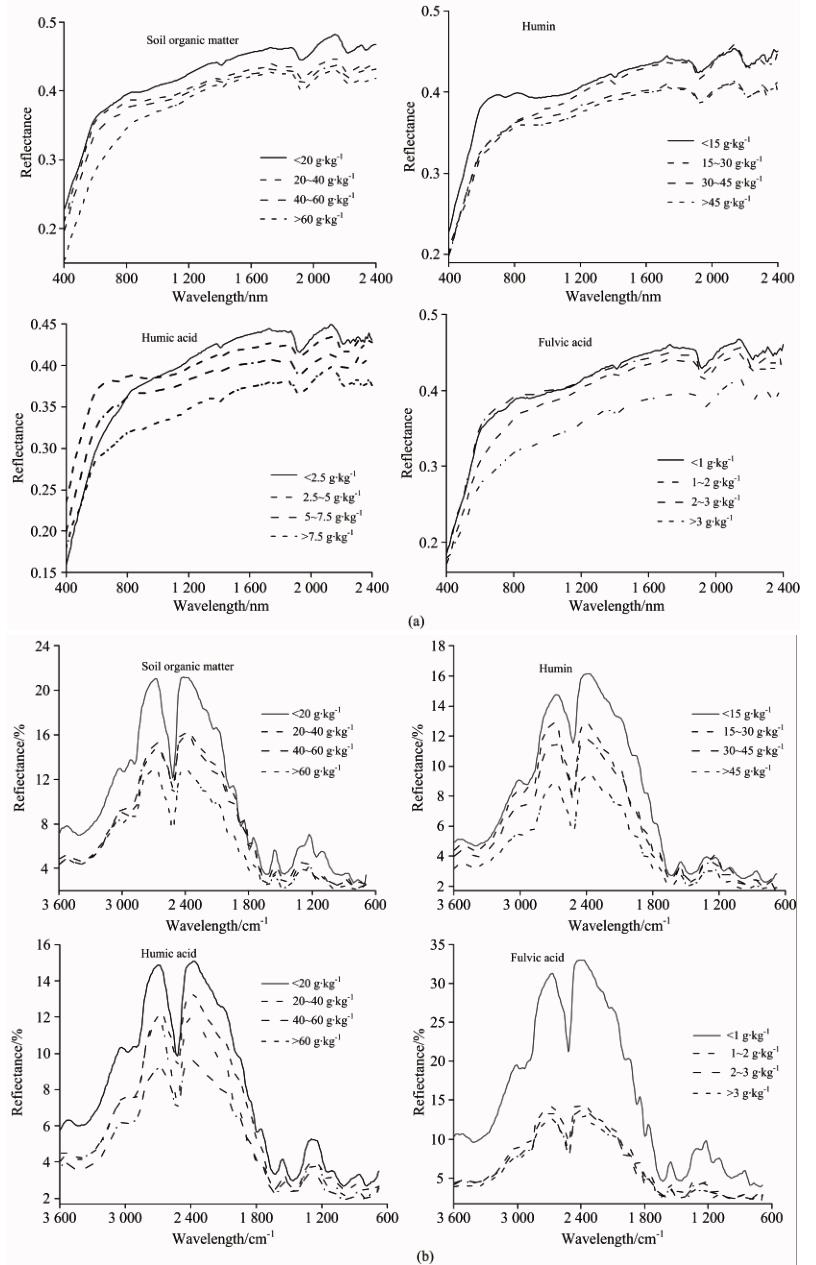
    Fig. 1. VNIR (a) and MIR (b) reflectance spectra of soil organic matter and fractions
    Correlations between soil organic matter content and visible-near infrared (a), mid-infrared (b) reflectivity
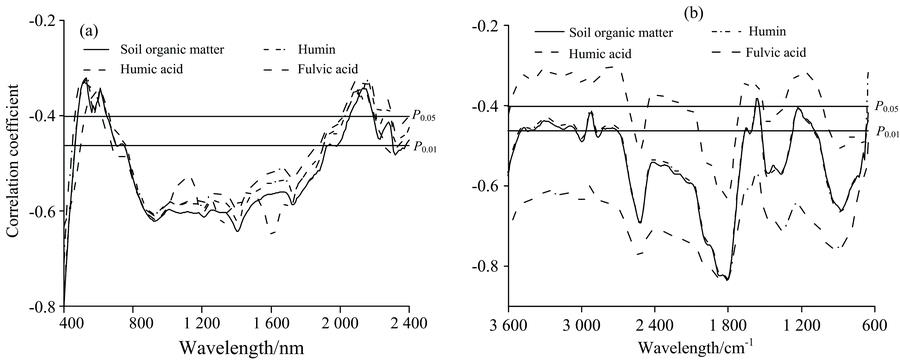
    Fig. 2. Correlations between soil organic matter content and visible-near infrared (a), mid-infrared (b) reflectivity
    Scatter plots of predicted vs. measured values for single model (a) and combination model (b)
    Fig. 3. Scatter plots of predicted vs. measured values for single model (a) and combination model (b)
    测定指标单位样本数平均值/
    (g·kg-1)
    标准差/
    (g·kg-1)
    最大值/
    (g·kg-1)
    最小值/
    (g·kg-1)
    峰度/
    (g·kg-1)
    变异
    系数/%
    有机质(g·kg-1)9327.2412.5068.0212.521.4345.87
    胡敏素(g·kg-1)9321.8110.8759.509.442.6149.86
    富里酸(g·kg-1)931.651.004.900.051.6860.56
    胡敏酸(g·kg-1)932.521.488.590.722.6358.75
    Table 1. Statistics of soil organic matter and fractions
    光谱模型精度指标有机质/(g·kg-1)胡敏素/(g·kg-1)胡敏酸/(g·kg-1)富里酸/(g·kg-1)
    建模预测建模预测建模预测建模预测
    VIS-NIRPLSRR20.800.770.830.810.820.810.850.85
    RMSE5.175.734.334.370.530.670.370.40
    RPIQ2.392.372.732.722.922.873.462.81
    RFR20.830.810.930.920.930.920.800.76
    RMSE4.143.962.442.660.340.340.350.36
    RPIQ3.362.364.874.614.753.934.003.10
    SVMR20.750.730.800.770.710.700.830.80
    RMSE4.595.744.114.150.620.650.320.39
    RPIQ2.702.372.962.863.182.954.092.90
    MIRPLSRR20.780.750.820.810.740.740.900.88
    RMSE5.425.554.414.450.600.660.300.40
    RPIQ2.952.422.682.672.672.564.382.82
    RFR20.870.860.890.870.880.860.940.94
    RMSE3.872.512.643.790.420.330.220.24
    RPIQ3.891.914.512.753.624.566.084.41
    SVMR20.800.780.780.770.740.740.800.76
    RMSE5.045.243.944.400.620.710.360.44
    RPIQ2.462.592.992.702.492.713.642.59
    VIS-NIR-MIRPLSRR20.800.780.850.810.830.800.860.80
    RMSE4.785.013.634.350.530.670.390.71
    RPIQ2.792.713.252.732.832.873.632.07
    RFR20.920.900.880.870.890.890.870.87
    RMSE2.904.082.962.840.410.330.310.31
    RPIQ4.523.514.142.633.654.583.994.28
    SVMR20.860.850.870.850.840.830.850.83
    RMSE3.814.073.603.690.440.520.300.41
    RPIQ3.253.343.283.223.683.674.283.44
    Table 2. Construction and verification of PLSR, SVM, and RF models based on different spectra
    De-fang LUO, Jie PENG, Chun-hui FENG, Wei-yang LIU, Wen-jun JI, Nan WANG. Inversion of Soil Organic Matter Fraction in Southern Xinjiang by Visible-Near-Infrared and Mid-Infrared Spectra[J]. Spectroscopy and Spectral Analysis, 2021, 41(10): 3069
    Download Citation