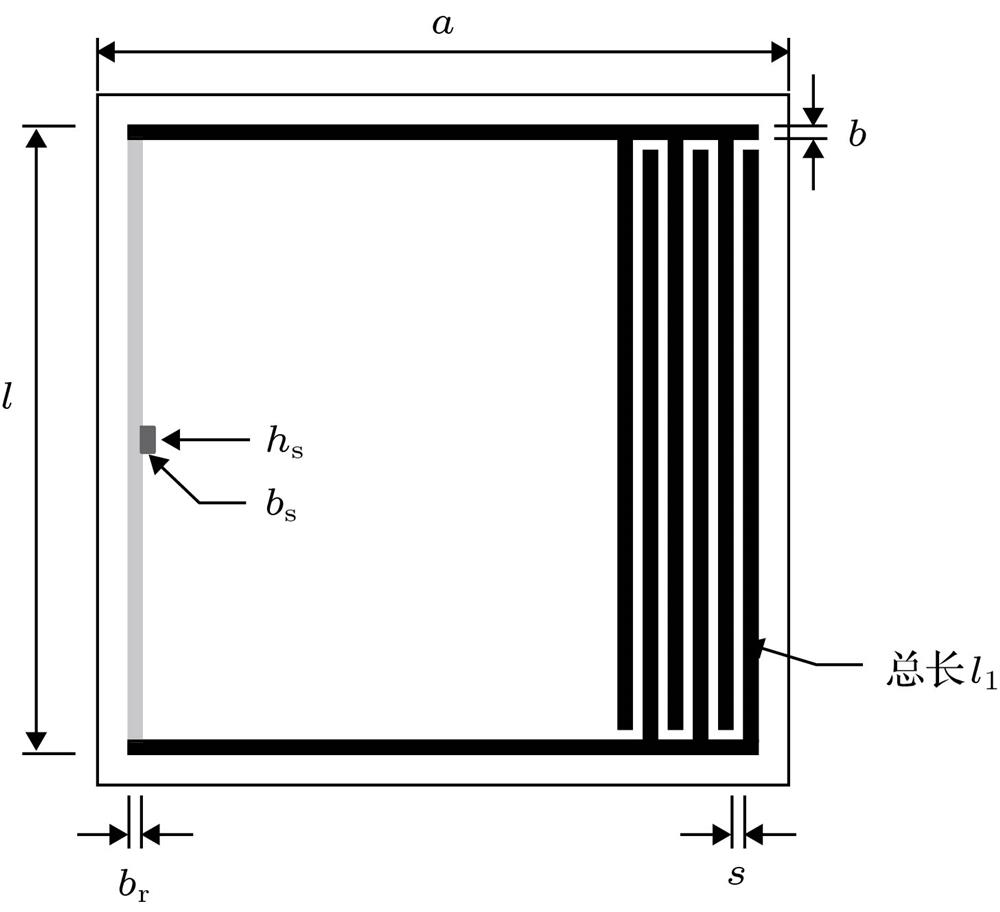
Fig. 1. Cross section of Helmholtz resonator structure with a membrane wall.带薄膜壁的Helmholtz结构横截面
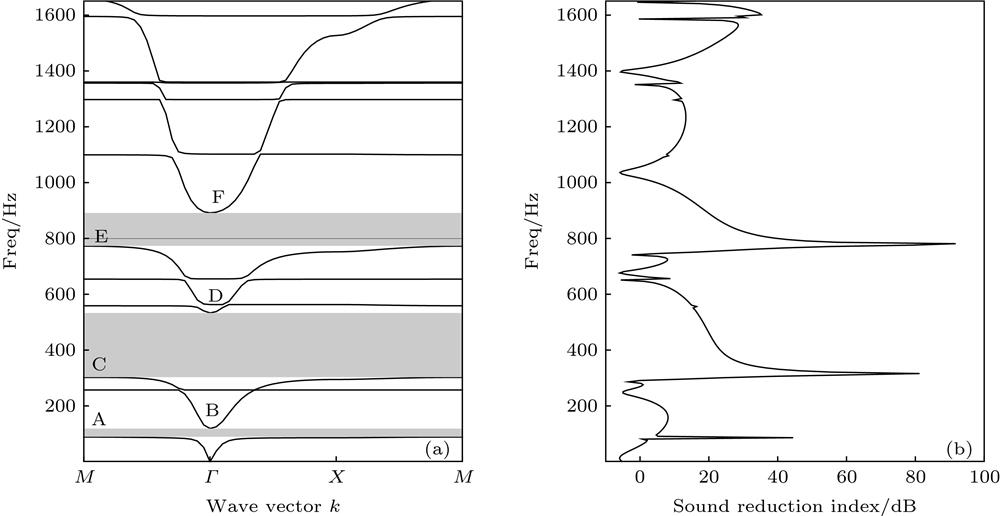
Fig. 2. Band diagram (a) and transmission spectrum (b) of the Helmholtz resonator structure with a membrane wall.带薄膜壁的Helmholtz结构 (a) 带隙图; (b) 隔声曲线
Fig. 3. Band diagram (a) and transmission spectrum (b) of the ordinary Helmholtz resonator structure.普通Helmholtz结构的(a)带隙图和(b)隔声曲线
Fig. 4. Vibration mode of the membrane and sound pressure distribution diagrams of point A (88.40 Hz) (a), B (119.06 Hz) (b), C (302.09 Hz) (c), D (533.03 Hz) (d), E (772.31 Hz) (e), and F (891.44 Hz) (f).(a) 模态A (88.40 Hz)、(b) 模态B (119.06 Hz)、(c) 模态C (302.09 Hz)、(d) 模态D (533.03 Hz)、(e) 模态E (772.31 Hz)、(f) 模态F (891.44 Hz) 的薄膜振型和声场压力图
Fig. 5. (a) System corresponding to starting frequency of band gaps; (b) system corresponding to cut-off frequency of band gaps.(a) 带隙下限系统示意图; (b) 带隙上限系统示意图
Fig. 6. Sound pressure distribution diagrams at starting frequency (a) and cutoff frequency (b) of the 3th band gap when l1 = 295 mm.
l1 = 295 mm时(a) 第三带隙下限和(b) 第三带隙上限的声场压力图
| ls/10–3 m
| 第一带隙下限 | | 第一带隙上限 | | 第二带隙下限 | | 第二带隙上限 | | 第三带隙下限 | | 第三带隙上限 | | FEM
TMM
| 误差/% | FEM
TMM
| 误差/% | FEM
TMM
| 误差/% | FEM
TMM
| 误差/% | FEM
TMM
| 误差/% | FEM
TMM
| 误差/% | | 4 | 89.2 | 3.7 | | 121.4 | 4.4 | | 314.2 | 2.8 | | 557.7 | 0.6 | | 790.7 | 2.2 | | 900.3 | 1.6 | | 92.5 | 126.7 | 323.0 | 561.2 | 808.3 | 914.7 | | 6 | 88.9 | 3.6 | 120.1 | 4.2 | 297.7 | 1.8 | 526.8 | –0.8 | 789.1 | 0.4 | 905.2 | 0.8 | | 92.2 | 125.1 | 303.1 | 522.8 | 792.4 | 912.2 | | 8 | 88.7 | 3.5 | 118.9 | 3.9 | 285.1 | 0.9 | 508.3 | –2.1 | 795.6 | –1.1 | 916.1 | –0.5 | | 91.9 | 123.5 | 287.6 | 497.5 | 786.8 | 912.0 | | 10 | 88.6 | 3.4 | 117.9 | 3.5 | 275.6 | –0.1 | 497.9 | –3.5 | 815.9 | –3.7 | 932.5 | –2.3 | | 91.6 | 122.0 | 275.4 | 480.5 | 786.0 | 910.8 | | 12 | 88.5 | 3.1 | 117.2 | 3.0 | 268.4 | –1.0 | 492.6 | –4.8 | 843.8 | –6.9 | 953.9 | –5.2 | | 91.3 | 120.7 | 265.6 | 469.1 | 785.3 | 904.4 | | 14 | 88.5 | 2.8 | 116.7 | 2.3 | 262.9 | –2.0 | 490.5 | –5.9 | 878.5 | –11 | 966.3 | –8.2 | | 91.0 | 119.4 | 257.6 | 461.5 | 779.9 | 887.3 |
|
Table 1. Effect of the parameter ls on low-frequency band gaps.
| ls/10–3 m
| 4 | 6 | 8 | 10 | 12 | 14 | | 1阶固有频率 | 252.4 | 237.9 | 226.8 | 218.2 | 211.6 | 206.6 | | 2阶固有频率 | 751.3 | 782.8 | 794.0 | 814.8 | 843.4 | 879.1 |
|
Table 2. Effect of the parameter ls on natural frequency of membrane.
| T/106N·m–1 | 第一带隙下限 | | 第一带隙上限 | | 第二带隙下限 | | 第二带隙上限 | | 第三带隙下限 | | 第三带隙上限 | | FEM
TMM
| 误差/% | FEM
TMM
| 误差/% | FEM
TMM
| 误差/% | FEM
TMM
| 误差/% | FEM
TMM
| 误差/% | FEM
TMM
| 误差/% | | 0.5 | 74.3 | 3.4 | | 89.3 | 2.8 | | 259.2 | 0.7 | | 440.3 | –1.2 | | 574.1 | 0.1 | | 770.1 | 0.5 | | 76.8 | 91.8 | 261.0 | 434.9 | 574.4 | 774.3 | | 1.5 | 96.3 | 3.4 | 143.1 | 4.6 | 345.5 | 3.2 | 589.6 | 0.2 | 952.1 | 2.2 | 1035.1 | 1.7 | | 99.6 | 149.7 | 356.7 | 591.0 | 973.0 | 1053.1 | | 2.5 | 103.3 | 2.9 | 174.6 | 4.6 | 415.0 | 4.2 | 648.0 | 0.7 | 1217.4 | 2.8 | 1274.1 | 2.3 | | 106.4 | 182.7 | 432.6 | 652.4 | 1251.0 | 1303.2 | | 3.5 | 106.8 | 2.7 | 196.4 | 4.4 | 474.9 | 4.8 | 691.4 | 1.1 | 1434.1 | 3.0 | 1478.6 | 2.5 | | 109.6 | 205.0 | 497.6 | 698.8 | 1477.6 | 1516.1 | | 4.5 | 108.8 | 2.5 | 212.5 | 4.1 | 528.2 | 5.1 | 729.6 | 1.4 | 1621.6 | 3.2 | 1642.5 | 3.3 | | 111.5 | 221.3 | 555.2 | 740.1 | 1673.4 | 1696.5 | | 10 | 113.0 | 2.1 | 257.8 | 3.0 | 757.3 | 5.9 | 907.9 | 2.7 | 1645.9 | 5.8 | 1741.8 | 3.1 | | 115.3 | 265.6 | 801.7 | 932.8 | 1740.6 | 1796.2 | | 100 | 116.2 | 1.8 | 311.0 | 1.2 | 1654.1 | 5.2 | 1737.3 | 3.1 | 2270.8 | 9.0 | 2375.3 | 6.1 | | 118.3 | 314.9 | 1740.4 | 1791.6 | 2475.7 | 2520.3 |
|
Table 3. Effect of the parameter T on low-frequency band gaps.
| l1/mm
| 第一带隙下限 | | 第一带隙上限 | | 第二带隙下限 | | 第二带隙上限 | | 第三带隙下限 | | 第三带隙上限 | | FEM
TMM
| 误差/% | FEM
TMM
| 误差/% | FEM
TMM
| 误差/% | FEM
TMM
| 误差/% | FEM
TMM
| 误差/% | FEM
TMM
| 误差/% | | 99 | 88.4 | 4.4 | | 119.1 | 5.7 | | 302.1 | 3.4 | | 533.0 | 1.3 | | 772.3 | 3.4 | | 891.4 | 2.4 | | 92.3 | 125.9 | 312.5 | 540.0 | 798.6 | 912.9 | | 148 | 74.5 | 3.4 | 101.5 | 5.1 | 301.2 | 3.5 | 513.3 | 1.1 | 772.6 | 3.4 | 873.7 | 2.4 | | 77.1 | 106.7 | 311.7 | 519.1 | 798.9 | 894.4 | | 197 | 66.0 | 2.9 | 89.9 | 4.7 | 301.9 | 3.5 | 500.0 | 1.1 | 772.4 | 3.3 | 836.0 | 1.9 | | 67.9 | 94.1 | 312.5 | 505.3 | 798.2 | 851.8 | | 246 | 60.1 | 2.6 | 81.4 | 4.5 | 303.2 | 3.5 | 488.5 | 1.0 | 697.6 | 1.2 | 734.1 | 0.9 | | 61.7 | 85.1 | 313.7 | 493.3 | 705.9 | 740.6 | | 295 | 55.8 | 2.5 | 75.0 | 4.3 | 304.7 | 3.4 | 475.7 | 0.9 | 587.8 | 0.7 | 637.5 | 0.7 | | 57.2 | 78.2 | 315.2 | 479.9 | 591.9 | 642.3 | | 344 | 52.5 | 2.4 | 69.8 | 4.2 | 306.3 | 3.4 | 458.4 | 0.7 | 507.5 | 0.6 | 558.9 | 3.1 | | 53.7 | 72.7 | 316.6 | 461.5 | 510.8 | 576.4 |
|
Table 4. Effect of the parameter l1 on low-frequency band gaps.
| V2/10–4 m3 | 第一带隙下限 | | 第一带隙上限 | | 第二带隙下限 | | 第二带隙上限 | | 第三带隙下限 | | 第三带隙上限 | | FEM
TMM
| 误差/% | FEM
TMM
| 误差/% | FEM
TMM
| 误差/% | FEM
TMM
| 误差/% | FEM
TMM
| 误差/% | FEM
TMM
| 误差/% | | 7.07 | 108.5 | 6.3 | | 120.5 | 5.8 | | 406.9 | 1.0 | | 566.2 | 1.0 | | 809.9 | 1.9 | | 953.1 | 1.2 | | 115.3 | 127.6 | 411.0 | 571.8 | 825.3 | 964.2 | | 10.57 | 103.3 | 4.8 | 121.1 | 4.8 | 361.4 | 1.6 | 558.3 | –0.1 | 796.5 | 1.9 | 925.4 | 1.4 | | 108.3 | 126.8 | 367.2 | 557.8 | 811.4 | 938.7 | | 14.07 | 98.0 | 4.2 | 121.0 | 4.4 | 335.0 | 1.9 | 550.0 | –0.1 | 790.9 | 1.8 | 913.1 | 1.4 | | 102.2 | 126.4 | 341.3 | 549.4 | 804.9 | 925.8 | | 17.57 | 93.3 | 3.9 | 120.9 | 4.3 | 317.7 | 2.1 | 544.4 | –0.1 | 788.3 | 1.6 | 906.5 | 1.3 | | 96.9 | 126.1 | 324.4 | 543.9 | 801.1 | 918.1 | | 19.32 | 91.1 | 3.8 | 120.8 | 4.3 | 311.1 | 2.2 | 542.3 | –0.1 | 787.4 | 1.6 | 904.1 | 1.2 | | 94.5 | 126.0 | 317.9 | 541.8 | 799.7 | 915.3 |
|
Table 5. Effect of the parameter V2 on low-frequency band gaps.