Abstract
We investigate the 120 keV hydrogen ion-implanted samples. To observe the implantation-induced crystal structure and composition changes we use Raman scattering, infrared spectroscopy, and cross-section transmission electron microscopy. In addition, elastic recoil detection analysis is used to detect the hydrogen concentration. Experimental results show that hydrogen ions mainly participate in the formation of platelets and micro-cracks, and diffuse out during the thermal process. Only a small portion of hydrogen is attached to the Li site and Li vacancy to form O-H. The content decrease of Li after hydrogen implantation was discussed.As optical components continue to replace electronics in signal processing applications, there is a growing impetus to miniaturize and integrate photonic devices on a single chip[1]. In the last few years, strong efforts have been made to manufacture silicon based photonic chips. The ion implantation-based Smart Cut technique is an industrial way to produce high quality silicon-on-insulator (SOI) wafers with the current technologies used in the microelectronic industry. This method was also used for fabrication of single-crystalline thin films on insulators. The most representative example is helium ion-sliced (LN) thin film.
(LT) and LN belong to the -type ferroelectrics with oxygen octahedra. Actually, the structure and optical properties of LT and LN are very similar. LT is one of the most excellent and useful materials for piezoelectric, electro-optic, and nonlinear optical applications, such as infrared (IR) thermal detectors, surface acoustic wave devices, integrated-optical devices, and quasi-phase-matched wavelength converters[2]. Many of these applications also require a high-quality single-crystal thin film that can be integrated onto planar structures. There have been studies on producing single-crystalline LT thin film on silicon by hydrogen implantation and wafer bonding[3].
So far, research on LT crystal ion slicing (CIS) has only focused on the possibility of developing the technique for specific devices. However, there is not yet a full understanding of the compositional and structural changes of LT in the slicing process. A concrete understanding of the slicing physics and the optimal conditions are essential to determining the technique’s capability for material processing in practical applications. In this paper, we investigate the hydrogen-induced LT changes by using a variety of detection techniques. The behavior of implanted hydrogen ions is specifically discussed.
Sign up for Chinese Optics Letters TOC. Get the latest issue of Chinese Optics Letters delivered right to you!Sign up now
Z-cut congruent optically polished LT wafer pieces were implanted with 120 keV H ions in the dose range of at room temperature. During the implantation the ion beam was electrically scanned to ensure a uniform implantation over the samples, which were tilted by 7° relative to the beam direction in order to minimize the channeling. Stopping and range of ion matter (SRIM 2013) was used to simulate the ion depth distributions. Elastic recoil detection (ERD) analysis was performed to measure the hydrogen distribution using a 4.5 MeV analyzing beam. Selected samples were studied by cross-sectional transmission electron microscopy (TEM) to observe damage structure. Raman scattering experiments were carried out using the 632.8 nm exciting line of a He-Ne laser with 30 mW output power. The OH-stretch-mode absorption spectra were measured by an IR spectrometer with the incident light along the c axis.
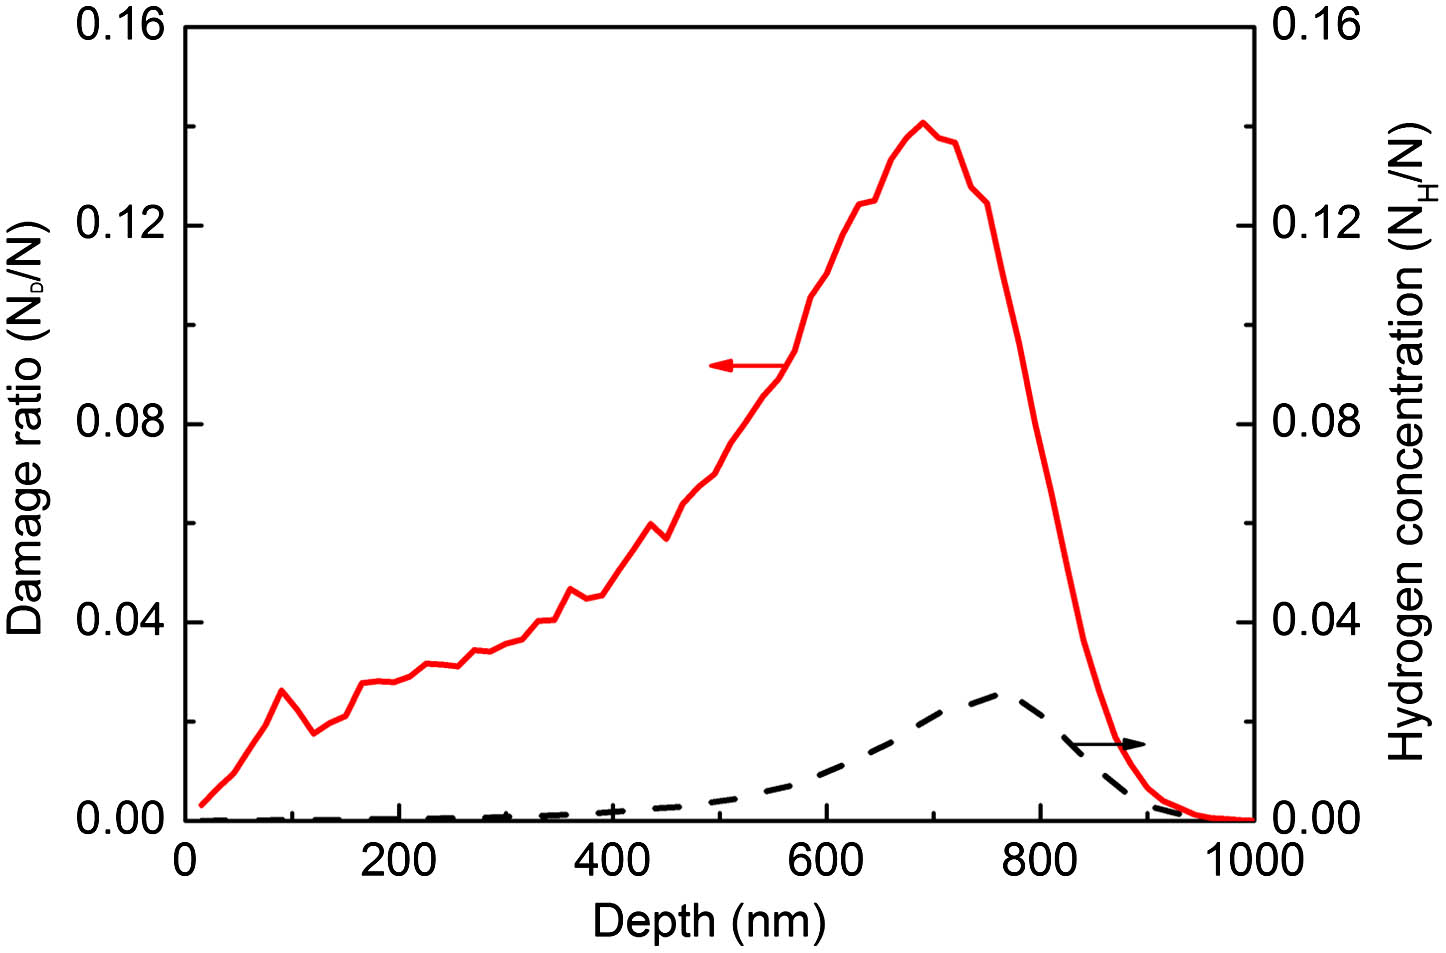
As simulated by SRIM, the hydrogen ion peak is located at below the sample surface. After implantation samples were annealed at 500°C for 30 minutes, thehydrogen ion distribution is also detected by ERD in the as-implanted and annealed samples. In all as-implanted samples the peak -concentrations are much lower than the predicted value according to SRIM simulation. After annealing, hydrogen concentration continues to decline. Taking the -implanted sample as example, the corresponding values are 0.6 and 0.28 at.%, respectively (Fig. 1). This result is significantly different from the case of -implanted Si crystal, where the measured ion concentration shows a good agreement with the simulation results in the as-implanted sample[4]. This difference is mainly due to the different diffusion ability of ions in and Si crystal as well as the different interaction mechanisms between the implanted hydrogen ion and samples. A strong diffusion is occurring during the implantation process as a high beam current density (3–4 μA) is used in our present experiment.
Similar to the cases in other -implanted optical crystals, a high density of extended defects are observed in the z-cut LT shown in Fig. 2. As is shown in the TEM image, a tail region of dense damage formed at the end of the implantation range. This tail region consists of clusters of rounded strain centers with lateral sizes between 10 and 20 nm. The surface blistering is induced by the thermal treatment shown in Table 1. It is believed that extended defect platelets, bubbles, and vacancies are generated during implantation and the following thermal process.

Figure 1.Vacancies and hydrogen concentration for H ions-implanted sample simulated by SRIM.
| Dose (×1016 cm−2) | Annealing | Surface blistering |
|---|
| 4 | 500°C, 30 min | No |
| 5 | 500°C, 30 min | No |
| 6 | 250°C, 30 min | Yes |
| 7 | 250°C, 10 min | Yes |
| 8 | 200°C, 30 min | Yes |
Table 1. Surface Blistering on Dependency of Experimental Parameters
Figure 2.Cross section TEM images of the as-implanted sample () (left); high magnification cross-sectional TEM image of dense damage region (right).
The bond characteristics in hydrogen-implanted LT are detected using Raman measurement and IR absorption spectra. There are a lot of intrinsic defects, Li vacancy and anti-site Ta ion, in congruent crystal. Previous studies showed that 278 and Raman modes have direct relationships with the intrinsic defects of crystals. The peak located at is related to and the other peak at comes from the vibration of anti-site [5–7]. In Fig. 3, the peak shape difference of the Raman shift at 142 and is attributed to the hydrogen implantation-induced LT composition changes. As is discussed in the previous study, the shape changes of 142 and ; namely, the width of Raman peaks, continuously decreases with increased Li content[5]. After annealing the mismatch among peak shapes disappears in this study. For the two Raman peaks, the integral areas (denoted as S) Simp, Svir, and Sann (representing the area for as-implanted, virgin, and annealed samples) are in the same descending order. The area is proportional to the Li vacancy () and Ta anti-site defects () content ions. Thus, the content of the Li vacancy () and Ta anti-site defects () increases in the as-implanted sample. However, thermal annealing leads to the hydrogen diffusion and the damage structure recovery due to mobile interstitials, and thus the corresponding peak area decreases after annealing. The concentration of the Li vacancy () and Ta anti-site defects () in the annealed sample is even lower than the virgin. This may be due to the interstitial filled into the Li vacancy.
Figure 3.Raman spectra of virgin, as-implanted, and annealed samples.
It is well known that ions might replace the Li ions or attach with O-O bonding, positioning themselves at the interstitials[8]. Because of the different electrical charges, H ions were easily attracted by the defects forming the of complexes. The ions were also attracted to the Li sites generating the vibrational mode of . The absorption peaks at 3463 and represent the absorption from and , respectively[9]. In our experiment, the absorption peaks in the as-implanted and annealed samples are higher than that of the virgin samples. This indicates that the implanted ions are involved in the formation of and . A previous study also found that the IR stretch-mode spectrum of OH in LT shows an expressed dependence on the crystal composition where the intensity ratio between peaks 3480 and is linearly dependent on the Li concentration[10]. According to their study, the content of Li in the as-implanted and annealed samples decreases in our experiment. We attribute this to the hydrogen implantation-induced higher Li vacancy and the replacement of Li by hydrogen ions. A deconvolution of the band shape of the OH spectra for different [Li]/[Ta] ratios gives three Lorentzian components: 3461, 3475, and [11]. LT belongs to the pseudo-ilmenite group composed of six planar rows of oxygen atoms in a distorted close-packed hexagonal structure. The OH absorption band should be formed by different components corresponding to protons coupling to - ions that are in six nonequivalent sites for the hydroxyl ions. However, formerly only two were well resolved, in Fig. 4[12]. Since the binding energy of O-H (459 kJ/mol) is very high, it is too difficult to release hydrogen from it and, considering the formation of surface blistering after annealing, the majority of hydrogen forms micro-cracks or platelets and diffuses out during the implantation and annealing process. So only a small portion of O-H formed during hydrogen implantation and the following annealing treatment.
Figure 4.IR absorption spectra of the samples.
We discuss the hydrogen-implanted LT, especially the behavior of hydrogen-induced structure and composition changes. Hydrogen concentration and behavior during the implantation and thermal process are detected by using ERD and TEM measurements. The properties of implantation-induced defects are analyzed based on the Raman and IR spectrometry techniques.
References
[1] G. Poberaj, M. Koechlin, F. Sulser, A. Guarino, J. Hajfler, P. Günter. Opt. Mater., 31, 1054(2009).
[2] A. H. M. González, A. Z. Simões, M. A. Zaghete, J. A. Varela. Mater. Charact., 50, 233(2003).
[3] W. Liu, D. Zhan, X. Ma, Z. Song, S. Feng. J. Vac. Sci. Technol., B26, 206(2008).
[4] T. Höchbauer, A. Misra, M. Nastasi, J. W. Mayer. J. Appl. Phys., 89, 5980(2001).
[5] L. Shi, Y. Kong, W. Yan, H. Liu, X. Li, X. Xie, D. Zhao, L. Sun, J. Xu, J. Sun, S. Chen, L. Zhang, Z. Huang, S. Liu, W. Zhang, G. Zhang. Solid State Commun., 135, 251(2005).
[6] Y. Repelin, E. Husson, F. Bennani, C. Proust. J. Phys. Chem. Solids, 60, 819(1999).
[7] Y. Kong, J. Xu, X. Chen, C. Zhang, W. Zhang, G. Zhang. J. Appl. Phys., 87, 4410(2000).
[8] S. V. Yevdokimov, A. V. Yatsenko. Crystallogr. Rep., 48, 542(2003).
[9] W. T. Hsu, Z. B. Chen, C. C. Wu, R. K. Choubey, C. W. Lan. Materials, 5, 227(2012).
[10] C. Bäumer, C. David, K. Betzler, H. Hesse, K. Lengyel, L. Kovács, M. Wöhlecke. Phys. Status Solidi A, 201, R13(2004).
[11] L. Shi, Y. Kong, W. Yan, J. Sun, S. Chen, L. Zhang, W. Zhang, H. Liu, X. Li, X. Xie, D. Zhao, L. Sun, Z. Wang, J. Xu, G. Zhang. Mater. Chem. Phys., 95, 229(2006).
[12] K. Lengyel, L. Kovács, G. Mandula, R. Rupp. Ferroelectrics, 257, 255(2001).