
Xie Yang, Yonggang Huo, Zujun Wang, Aiguo Shang, Yuanyuan Xue, Tongxuan Jia. Theoretical Simulation of Charge Transfer Loss Degradation of CMOS Image Sensor Induced by Displacement Damage[J]. Acta Optica Sinica, 2022, 42(7): 0723002
- Acta Optica Sinica
- Vol. 42, Issue 7, 0723002 (2022)
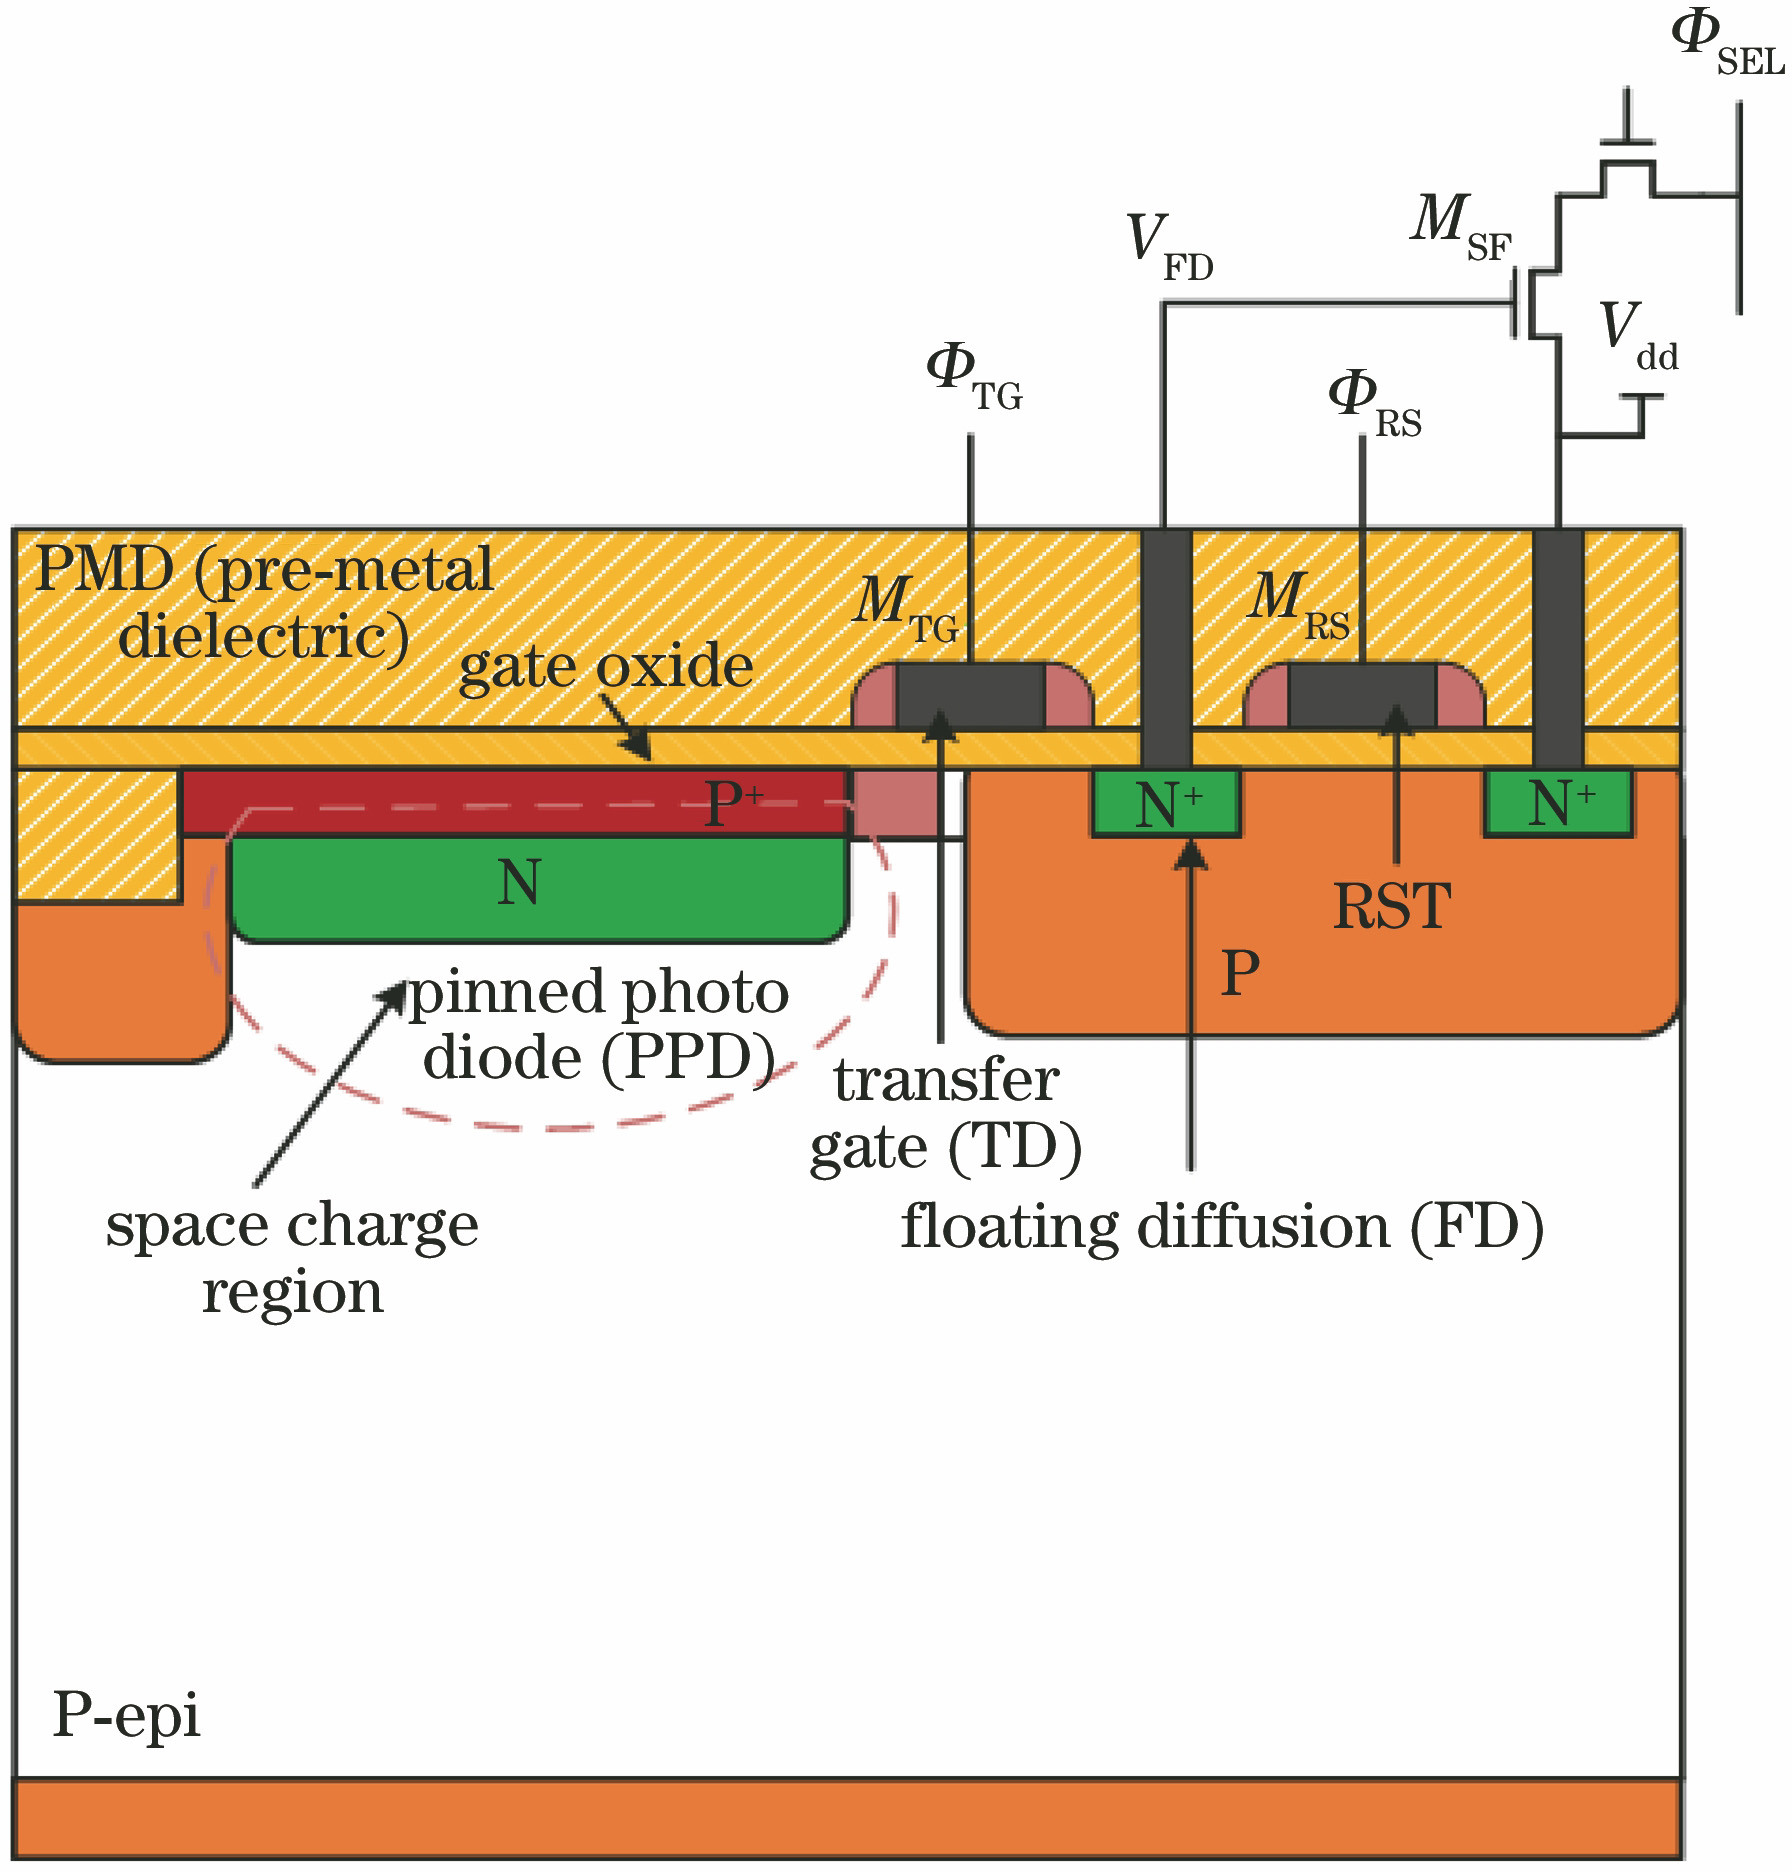
Fig. 1. Pixel unit structure in 4T PPD type CMOS image sensor
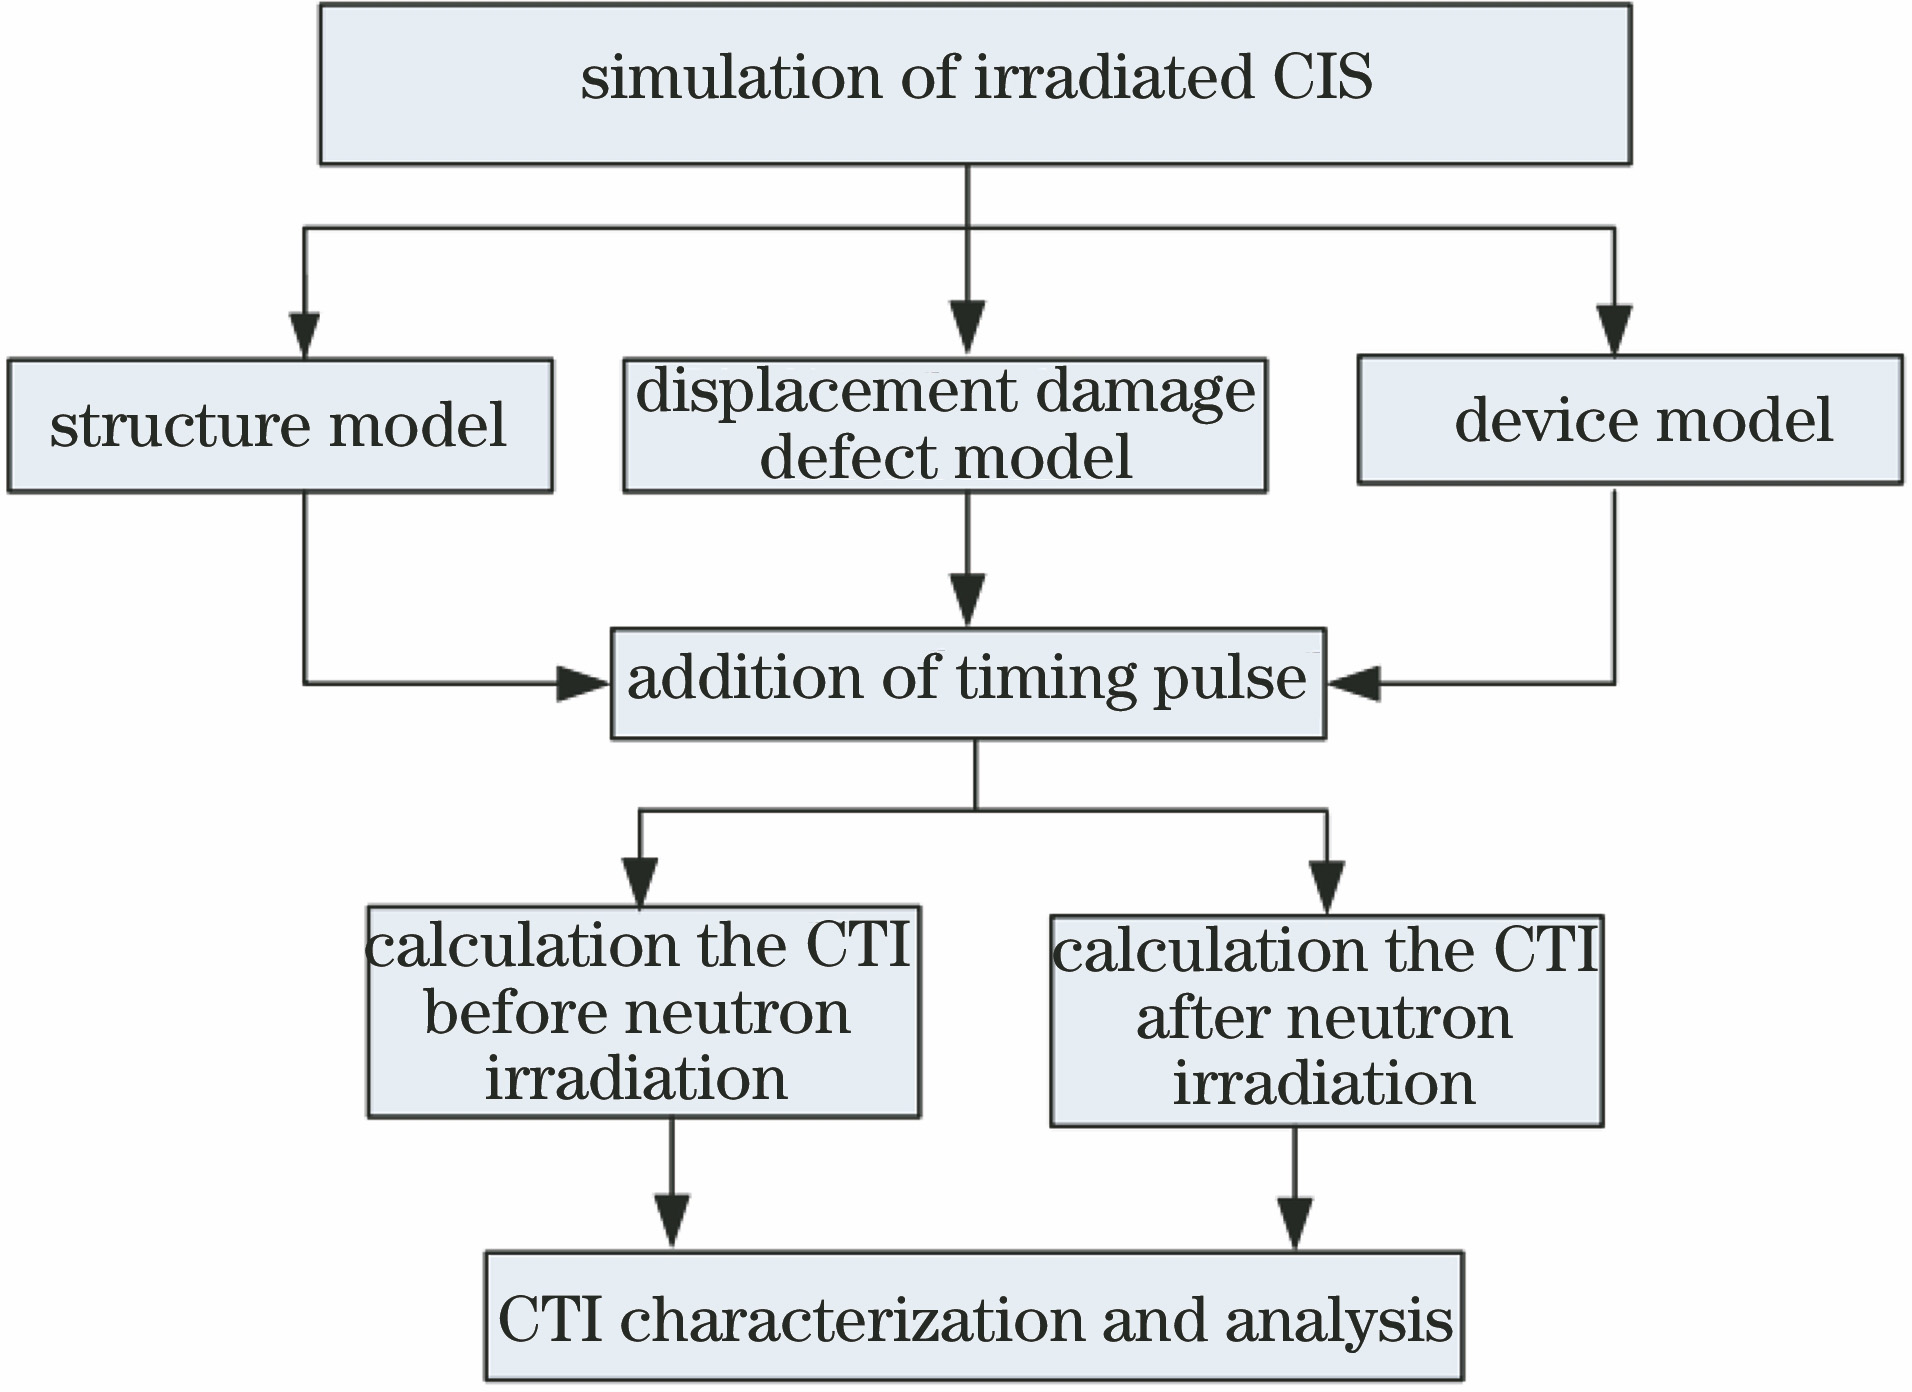
Fig. 2. Flowchart of simulation
Fig. 3. Doping distribution of pixel units in 4T PPT type CMOS image sensor
Fig. 4. Schematic of influence mechanism of charge transfer. (a) TG open; (b) TG shut down
Fig. 5. Driving timing in CTI theoretical simulation
Fig. 6. Electron concentration distribution of photogenerated charge in process of formation and transfer. (a) PPD is fully depleted before illumination; (b) photogenerated charge is collected in PPD after illumination; (c) photogenerated charge in PPD is transferred to FD when TG is turned on; (d) residual photogenerated charge in PPD after TG is turned off; (e) accumulated charge in PPD under dark field; (f) residual photogenerated charge in PPD is transferred to FD when TG is turned on
Fig. 7. Distribution of carriers captured by displacement damage defects after irradiation with different neutron injection amounts. (a) 0; (b) 1×10¹¹ neutron/cm2; (c) 5×10¹¹ neutron/cm2; (d) 1×10¹² neutron/cm2
Fig. 8. Variation curves of displacement damage defect filling rate with neutron irradiation fluence
Fig. 9. Variation curves of electron concentration in PPD with neutron irradiation fluence
Fig. 10. Test picture of CMOS image sensor
Fig. 11. Variation curve of CTI with neutron irradiation fluence
|
Table 1. Defect information in Si substrate after neutron irradiation with energy of 1 MeV[15]
|
Table 2. Degradation of charge transfer loss with neutron fluence

Set citation alerts for the article
Please enter your email address
© Copyright 2018-2021 | Chinese Laser Press. All Rights Reserved 沪ICP备15018463号-20