• Chinese Optics Letters
  • Vol. 17, Issue 4, 041701 (2019)
Lida Zhu1, Yi Wang2、*, Yi Yuan1, Hongxian Zhou3, Yuqian Zhao2, and Zhenhe Ma2
Author Affiliations
  • 1School of Electrical Engineering, Yanshan University, Qinhuangdao 066004, China
  • 2School of Control Engineering, Northeastern University at Qinhuangdao, Qinhuangdao 066004, China
  • 3Experiment Education Center, Northeastern University at Qinhuangdao, Qinhuangdao 066004, China
  • show less
    DOI: 10.3788/COL201917.041701 Cite this Article Set citation alerts
    Lida Zhu, Yi Wang, Yi Yuan, Hongxian Zhou, Yuqian Zhao, Zhenhe Ma. Spectral domain optical coherence tomography with sub-micrometer sensitivity for measurement of central corneal thickness[J]. Chinese Optics Letters, 2019, 17(4): 041701 Copy Citation Text show less
    Schematic of SD-OCT system. SLD, superluminescent diode; Cir, circulator; CP, coupler; GS, galvo scanner; BS, beam splitter; AC, area scan CCD; LC, line scan CCD; L1–6, lens; M, mirror; G, grating.
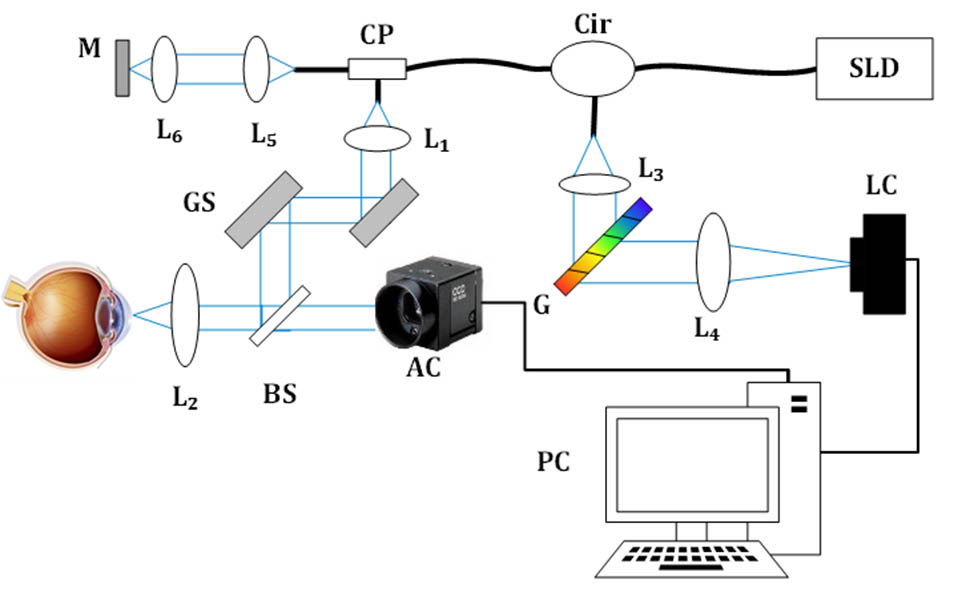
    Fig. 1. Schematic of SD-OCT system. SLD, superluminescent diode; Cir, circulator; CP, coupler; GS, galvo scanner; BS, beam splitter; AC, area scan CCD; LC, line scan CCD; L16, lens; M, mirror; G, grating.
    Calculation of phase wrapping order. Acquired interference fringe (a) before and (b) after band-pass filtering and normalization. (c) Correlations between detected and simulated fringes. (d) Comparison of detected fringes with simulated fringes.
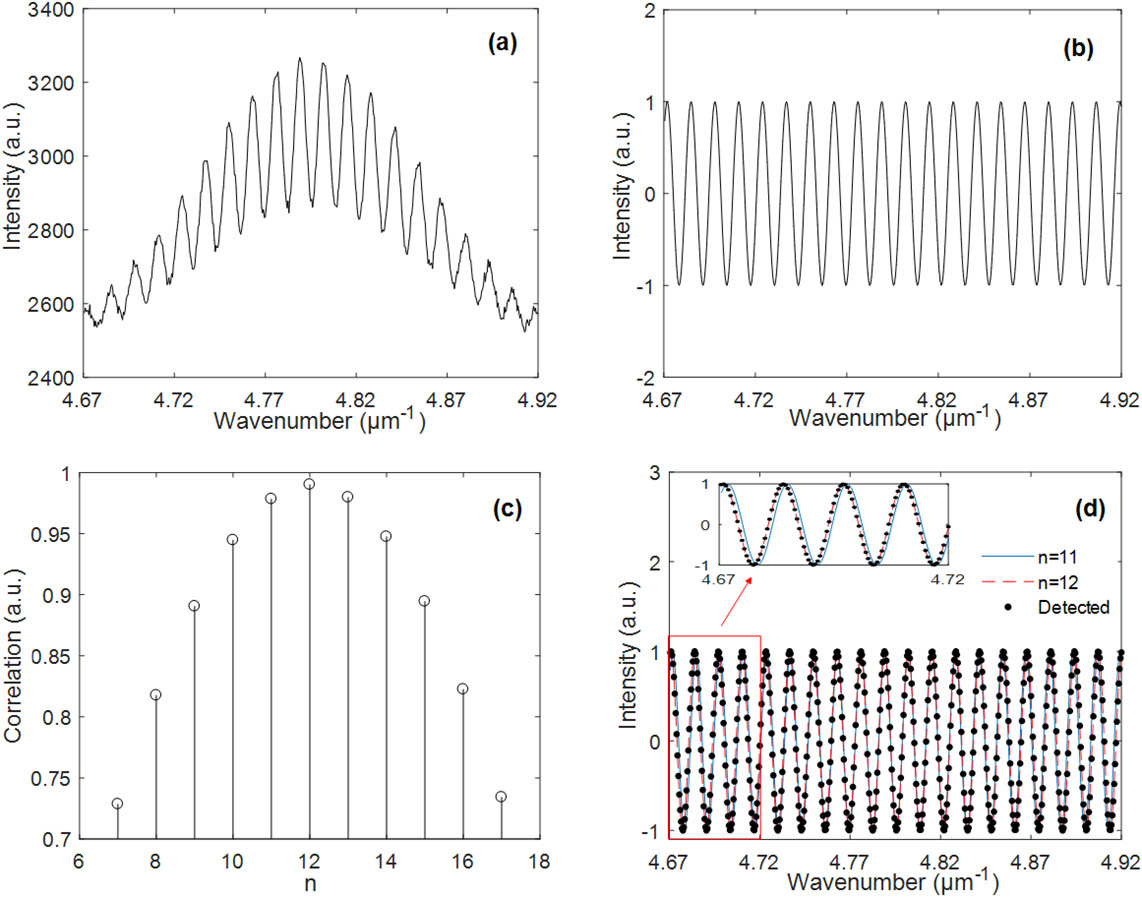
    Fig. 2. Calculation of phase wrapping order. Acquired interference fringe (a) before and (b) after band-pass filtering and normalization. (c) Correlations between detected and simulated fringes. (d) Comparison of detected fringes with simulated fringes.
    (a) Red line depicts the wrapped result calculated by FFT; the result by applying digital unwrapping is shown as the black line, and the blue line shows the result by the proposed method. (b) Histogram of thickness variances of a coverslip.
    Fig. 3. (a) Red line depicts the wrapped result calculated by FFT; the result by applying digital unwrapping is shown as the black line, and the blue line shows the result by the proposed method. (b) Histogram of thickness variances of a coverslip.
    (a) Cross-section image of cornea. (b) A-scan profile of central cornea at the meridian.
    Fig. 4. (a) Cross-section image of cornea. (b) A-scan profile of central cornea at the meridian.
    Boxplots of the results of CCT measurement.
    Fig. 5. Boxplots of the results of CCT measurement.
    Lida Zhu, Yi Wang, Yi Yuan, Hongxian Zhou, Yuqian Zhao, Zhenhe Ma. Spectral domain optical coherence tomography with sub-micrometer sensitivity for measurement of central corneal thickness[J]. Chinese Optics Letters, 2019, 17(4): 041701
    Download Citation