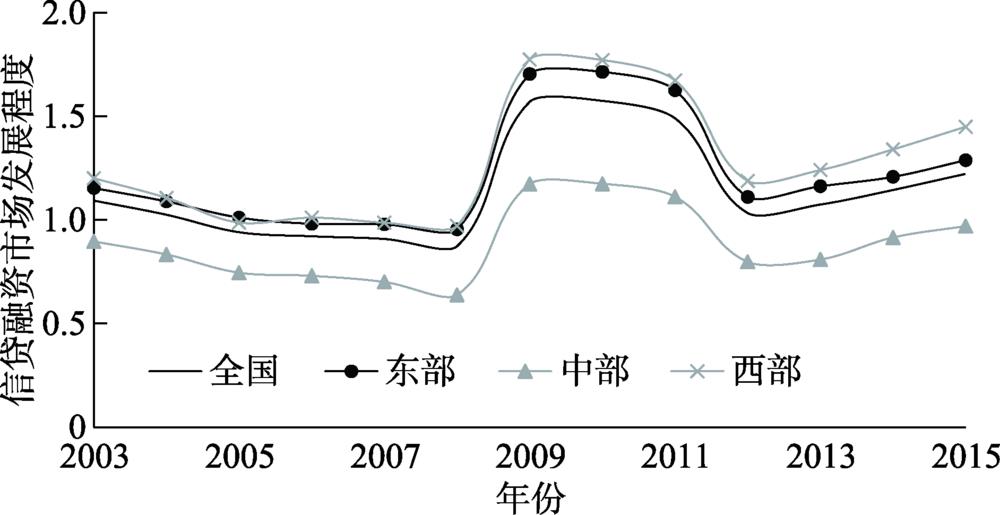
Fig. 1. The development of credit market in China (2003-2015)
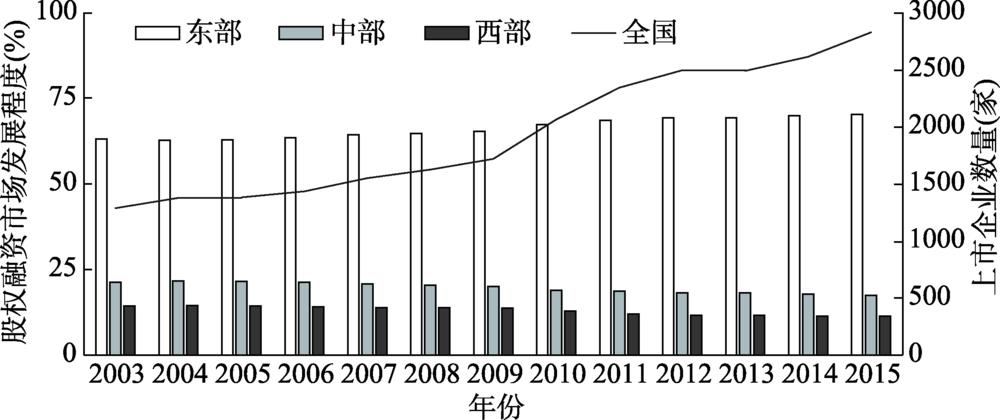
Fig. 2. The development of equity market in China (2003-2015)
Fig. 3. The development of credit market in Chinese cities (2003, 2008, 2015)
Fig. 4. The development of equity market in Chinese cities (2003, 2008, 2015)
Fig. 5. The share of emerging industries in Chinese cities (2004, 2009, 2016)
| Density | Credit | Equity | RC_Credit | RC_Equity | SOE | Eco | HumC | Pop | Mean | Std |
|---|
| Density | 1 | | | | | | | | | 0.096 | 0.082 | | Credit | 0.29*** | 1 | | | | | | | | 0.999 | 0.588 | | Equity | 0.01*** | 0.04*** | 1 | | | | | | | 0.009 | 0.069 | | RC_Credit | -0.12*** | 0.58*** | -0.01*** | 1 | | | | | | 1.804 | 0.594 | | RC_Equity | 0.38*** | 0.46*** | 0.15*** | 0.06*** | 1 | | | | | 0.005 | 0.012 | | SOE | 0.15*** | 0.13*** | 0.04*** | -0.01*** | 0.21*** | 1 | | | | 0.029 | 0.155 | | Eco | 0.34*** | 0.23*** | 0.01*** | 0.08*** | 0.36*** | 0.04*** | 1 | | | 39005.6 | 31516.0 | | HumC | 0.36*** | 0.56*** | 0.05*** | 0.08*** | 0.48*** | 0.17*** | 0.31*** | 1 | | 118228.5 | 175174.7 | | Pop | 0.23*** | 0.14*** | 0.02*** | -0.06*** | 0.32*** | 0.08*** | -0.04*** | 0.49*** | 1 | 507.38 | 359.33 |
|
Table 1. Description of variables
| 模型1 | 模型2 | 模型3 | 模型4 | 模型5 |
|---|
| Density | 2.777*** | 2.882*** | 3.071*** | 2.987*** | 1.193*** | | Credit | | 0.071*** | | 0.068*** | | | Equity | | 3.086*** | | 4.052*** | | | RC_Credit | | | 0.135*** | | 0.028*** | | RC_Equity | | | -5.037*** | | -10.377*** | | CreditDensity | | | | 0.415*** | | | EquityDensity | | | | -40.521*** | | | RC_CreditDensity | | | | | 0.906*** | | RC_EquityDensity | | | | | 35.413*** | | SOE | 0.046*** | -0.011 | 0.156*** | 0.063*** | 0.156*** | | Eco | -5.102e-07*** | -5.340e-07*** | -5.561e-07*** | -8.922e-08 | -4.832e-07*** | | HumC | 2.238e-07*** | 1.977e-08 | 3.114e-07*** | 2.653e-08 | 3.143e-07*** | | Pop | -0.00013418*** | -0.00011851*** | -0.0001*** | -0.00004024*** | -0.00012485*** | | Con | -1.308*** | -1.416*** | -1.5620281*** | -1.506*** | -1.350*** | | N | 582565 | 582425 | 567003 | 582425 | 567003 | | R | 0.03 | 0.06 | 0.03 | 0.06 | 0.04 | | Log likelihood | -240562.88 | -233908.44 | -232217.24 | -232396.6 | -231949.46 | | Chi | 14421.74 | 27570.92 | 16701.58 | 30594.59 | 17237.13 |
|
Table 2. Impact of financial markets on the evolution of manufacturing industries (2004-2016)
| 2004—2008年 | | 2009—2016年 |
|---|
| 模型1 | 模型2 | 模型3 | 模型4 | 模型5 | 模型6 | 模型7 | 模型8 | 模型9 | 模型10 |
|---|
| Density | 1.765*** | 1.871*** | 1.925*** | 2.671*** | -0.399* | | 3.585*** | 3.724*** | 3.816*** | 3.924*** | 3.087*** | | Credit | | 0.136*** | | 0.225*** | | | 0.025*** | | 0.046*** | | | Equity | | 3.181*** | | 3.895*** | | | 3.223*** | | 4.356*** | | | RC_Credit | | | 0.107*** | | -0.027 | | | 0.118*** | | 0.089*** | | RC_Equity | | | -2.053** | | -7.013*** | | | -2.760*** | | -10.039*** | | CreditDensity | | | | -0.232** | | | | | 0.156*** | | | EquityDensity | | | | -32.735*** | | | | | -32.962*** | | | RC_CreditDensity | | | | | 1.301*** | | | | | 0.218*** | | RC_EquityDensity | | | | | 33.505*** | | | | | 51.518*** | | SOE | 0.025 | -0.043* | 0.091*** | -0.006 | 0.082*** | 0.166*** | 0.120*** | 0.273*** | 0.189*** | 0.269*** | | Eco | -4.56e-06*** | -4.27e-06*** | -3.72e-06*** | -2.88e-06*** | -0.000*** | -1.41e-06*** | -1.58e-06*** | -1.34e-06*** | -1.05e-06*** | -1.27e-06*** | | HumC | 3.49e-07*** | -5.2e-08 | 4.639e-07*** | -3.11e-06*** | -3.86e-06*** | 2.29e-07*** | 1.26e-07*** | 2.54e-07*** | 1.12e-07*** | 2.32e-07*** | | Pop | -0.0001*** | -0.00004*** | -0.00004* | -1.6E-08 | 4.968e-07*** | -0.0002*** | -0.0002*** | -0.0002*** | -0.0001*** | -0.0002*** | | Con | -1.212*** | -1.380*** | -1.432*** | 1.56E-05 | -0.0000375* | -1.312*** | -1.370*** | -1.534*** | -1.476*** | -1.448*** | | N | 191639 | 191499 | 185607 | 191499 | 191639 | 390926 | 390926 | 381396 | 390926 | 381396 | | R | 0.01 | 0.05 | 0.02 | 0.06 | 0.02 | 0.04 | 0.06 | 0.05 | 0.07 | 0.05 | | Log likelihood | -73708.6 | -70634.9 | -71325.8 | -70098.2 | -71233.4 | -165592 | -161941 | -160024 | -161371 | -159919 | | Chi | 1914.3 | 7897.81 | 2414.39 | 8971.1 | 2599.35 | 14143.46 | 21445.28 | 15265.38 | 22856.29 | 15474.03 |
|
Table 3. Impact of financial markets on the evolution of local industries (2004-2008, 2009-2016)
| 东部 | | 中部 | | 西部 |
|---|
| 模型1 | 模型2 | 模型3 | 模型4 | 模型5 | 模型6 |
|---|
| Density | 4.546*** | 3.271*** | | 1.559*** | 3.218*** | | 4.310*** | -0.026 | | Credit | 0.121*** | | 0.041** | | 0.254*** | | | Equity | 4.065*** | | 12.091*** | | 4.266*** | | | RC_Credit | | 0.108*** | | 0.261*** | | -0.077*** | | RC_Equity | | -4.012*** | | -6.895** | | 18.712*** | | CreditDensity | 0.248*** | | 0.477*** | | 0.153 | | | EquityDensity | -37.078*** | | 10.698 | | 0.785 | | | RC_CreditDensity | | 0.361*** | | -1.211*** | | 1.789*** | | RC_EquityDensity | | -3.471 | | 114.496*** | | 76.216*** | | SOE | -0.131*** | -0.050** | 0.276*** | 0.301*** | 0.354*** | 0.424*** | | Eco | -7.2e-08 | -4.00e-07*** | 0.276*** | 1.32e-06*** | 3.75e-07 | -0.000 | | HumC | 2.722e-07*** | 4.48e-07*** | 2.26e-06*** | -5.26e-07*** | -6.826e-07*** | -2.109e-07*** | | Pop | -2e-05 | -0.000062*** | -7.95e-07*** | -0.0001*** | 3.1e-07 | -0.00051462*** | | Con | -1.805*** | -1.776*** | -1.246*** | -1.449*** | -1.765*** | -1.116*** | | N | 345270 | 333956 | 167942 | 167942 | 69213 | 65105 | | R | 0.07 | 0.06 | 0.06 | 0.01 | 0.12 | 0.09 | | Log likelihood | -131173 | -128018 | -71915.7 | -75217.7 | -26226 | -25513.4 | | Chi | 20499.8 | 15913.98 | 8622.04 | 2018 | 7038.18 | 5045.06 |
|
Table 4. Impact of financial markets on the evolution of local industries in eastern, central, and western China (2004-2016)