• Acta Optica Sinica
  • Vol. 43, Issue 12, 1228008 (2023)
Bowen Chen1、2、3, Shuo Shi2、3、4、*, Wei Gong2、3、4, Qian Xu2, Xingtao Tang2, Sifu Bi2, and Biwu Chen5
Author Affiliations
  • 1Chinese Antarctic Center of Surveying and Mapping, Wuhan University, Wuhan 430079, Hubei, China
  • 2State Key Laboratory of Information Engineering in Surveying, Mapping and Remote Sensing, Wuhan University, Wuhan 430079, Hubei, China
  • 3Electronic Information School, Wuhan University, Wuhan 430079, Hubei, China
  • 4Collaborative Innovation Center of Geospatial Technology, Wuhan 430079, Hubei, China
  • 5Shanghai Radio Equipment Research Institute, Shanghai 201109, China
  • show less
    DOI: 10.3788/AOS221717 Cite this Article Set citation alerts
    Bowen Chen, Shuo Shi, Wei Gong, Qian Xu, Xingtao Tang, Sifu Bi, Biwu Chen. Target Classification of Hyperspectral Lidar Based on Optimization Selection of Spatial-Spectral Features[J]. Acta Optica Sinica, 2023, 43(12): 1228008 Copy Citation Text show less
    System prototype of hyperspectral lidar
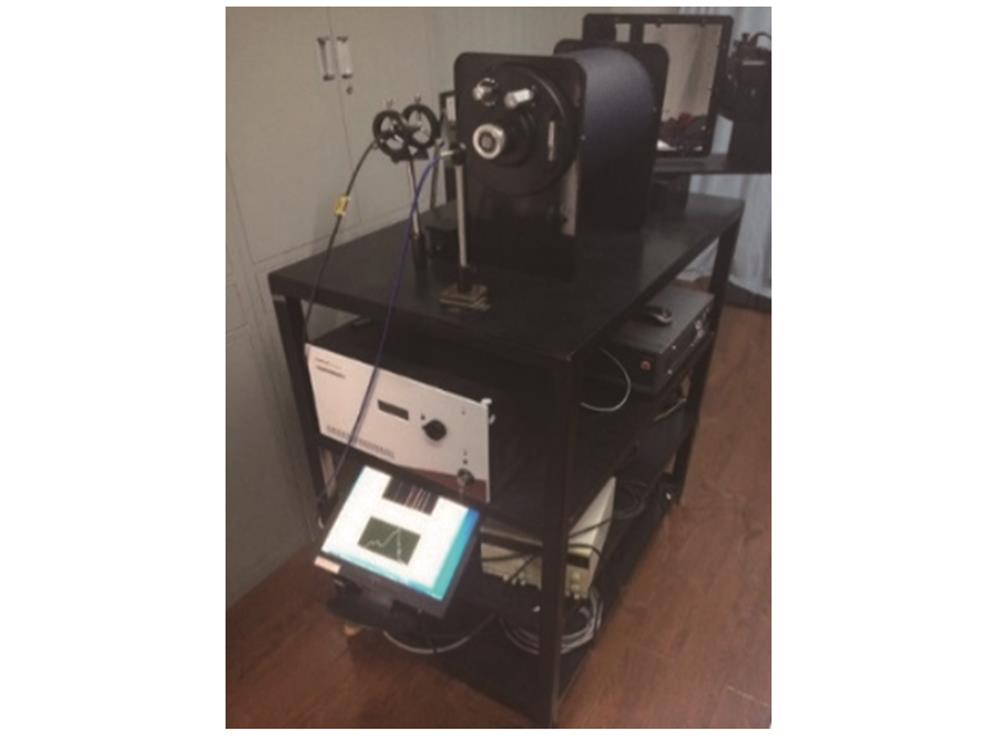
    Fig. 1. System prototype of hyperspectral lidar
    Scanning scene of 14 different targets
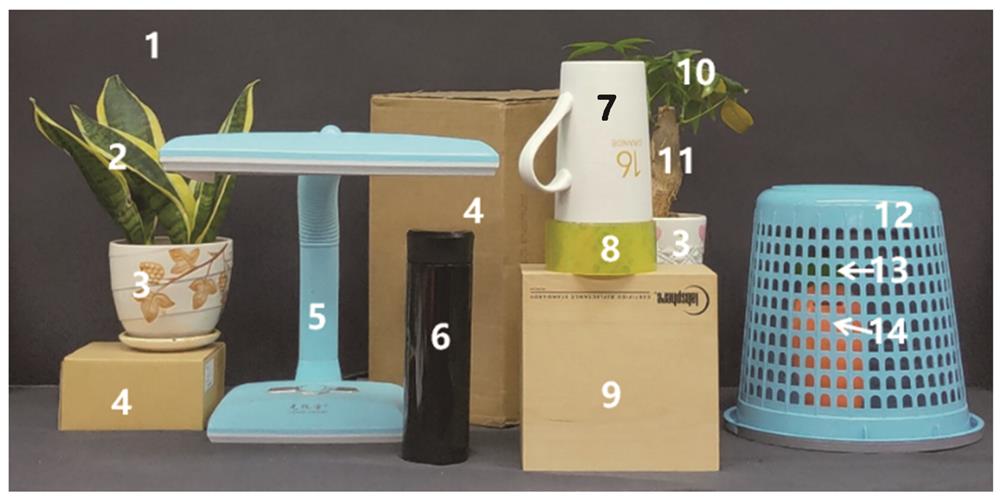
    Fig. 2. Scanning scene of 14 different targets
    Target classification processes based on hyperspectral lidar for spatial-spectral feature optimization selection
    Fig. 3. Target classification processes based on hyperspectral lidar for spatial-spectral feature optimization selection
    True color reconstruction result based on optimal band combination
    Fig. 4. True color reconstruction result based on optimal band combination
    Real categories of fourteen targets
    Fig. 5. Real categories of fourteen targets
    Target classification results of the first four classification strategies. (a) 32-channel spectral information and elevation value; (b) spectral indices; (c) geometric features; (d) spatial-spectral feature combination
    Fig. 6. Target classification results of the first four classification strategies. (a) 32-channel spectral information and elevation value; (b) spectral indices; (c) geometric features; (d) spatial-spectral feature combination
    Target classification results of the 5th and 6th classification strategies. (a) Spatial-spectral features selected by marine predator algorithm; (b) optimal spatial-spectral feature combination
    Fig. 7. Target classification results of the 5th and 6th classification strategies. (a) Spatial-spectral features selected by marine predator algorithm; (b) optimal spatial-spectral feature combination
    Correlation of spatial-spectral features
    Fig. 8. Correlation of spatial-spectral features
    Vegetation indexFormulaReference
    Differential vegetation index(DVI)R775-R67525
    Ratio vegetation index(RVI)R775R67526
    Enhanced vegetation index(EVI)2.5(R775-R675)1+R775+2.4R67527
    Soil adjusted vegetation index(SAVI)1.5(R775-R675)R775+R675+0.528
    Normalized differential vegetation index(NDVI)R775-R675R775+R67529
    Ratio normalized differential vegetation index(RNDVI)R7752-R675R775+R675230
    Red-edge chlorophyll index(CIred-edge)R745R705-131
    Modified chlorophyll absorption ratio index(MCARI)R695R665-0.2(R695-R495)R695R66532
    Plant senescence reflectance index(PSRI)R675-R495R74533
    Triangular vegetation index(TVI)0.5120R745-R495-200R665-R54534
    Table 1. Vegetation indices used in this study
    Color indexFormulaReference
    Excess green index(ExG)2G-R-B38
    Normalized green‑red difference index(NGRDI)G-RG+R39
    Normalized green‑blue difference index(NGBDI)G-BG+B40
    Excess red index(ExR)1.4R-G41
    Excess green minus excess red(ExGR)ExG-ExR42
    Visible atmospherically resistant index(VARI)G-RG+R-B43
    Visible‑band diference vegetation index(VDVI)2G-R-B2G+R+B44
    Modified green red vegetation index(MGRVI)G2-R2G2+R245
    Red green blue vegetation index(RGBVI)G2-RBG2+RB45
    Normalized redness intensity(NRI)RG+R+B46
    Green minus red difference index(GMR DI)G-R47
    Table 2. Color indices used in this study
    Target classification strategyClassification feature
    1Original spectral information and elevation
    2Spectral index features
    3Spatial features
    4Original spectral information,elevation,spectral index features,and spatial features
    5Spatial‑spectral features selected by marine predator algorithm
    6Optimal spatial-spectral feature combination
    Table 3. Six different target classification strategies
    Strategy123456
    OA /%91.4990.7389.5695.5796.6697.13
    AA /%77.7478.2768.2684.3787.4489.05
    Kappa0.89340.88370.86930.93800.95770.9642
    Time /s4.72(±0.32)4.18(±0.45)3.53(±0.22)5.16(±0.47)4.06(±0.18)3.61(±0.17)
    ClassPRPRPRPRPRPR
    10.980.960.980.951.000.991.001.001.001.001.001.00
    20.900.910.880.870.840.750.920.920.920.970.930.96
    30.820.790.750.800.680.760.830.880.890.910.910.92
    40.930.910.930.910.880.850.970.930.980.930.990.95
    50.810.880.840.880.920.930.910.930.940.950.910.97
    60.930.880.770.830.870.790.960.930.990.970.990.99
    70.880.860.900.840.730.700.950.910.970.960.980.95
    80.730.770.770.760.360.590.790.800.830.820.880.91
    90.900.930.900.930.870.920.940.960.940.970.970.97
    100.690.710.570.650.670.670.820.940.880.940.910.99
    110.670.900.770.810.330.510.860.880.860.890.890.86
    120.930.870.900.910.910.900.960.950.970.950.980.94
    130.331.000.400.750.200.330.400.860.400.860.470.88
    140.400.840.620.820.290.440.650.850.670.920.650.92
    Table 4. Classification accuracy summary
    Bowen Chen, Shuo Shi, Wei Gong, Qian Xu, Xingtao Tang, Sifu Bi, Biwu Chen. Target Classification of Hyperspectral Lidar Based on Optimization Selection of Spatial-Spectral Features[J]. Acta Optica Sinica, 2023, 43(12): 1228008
    Download Citation