
Jing Jin, Chunjing Liu, Jixun Liu, Yunxia Hou. Modeling and analyzing the temperature sensitivity of radiation-induced attenuation in a Ge-P co-doped fiber[J]. Chinese Optics Letters, 2016, 14(3): 030601
- Chinese Optics Letters
- Vol. 14, Issue 3, 030601 (2016)
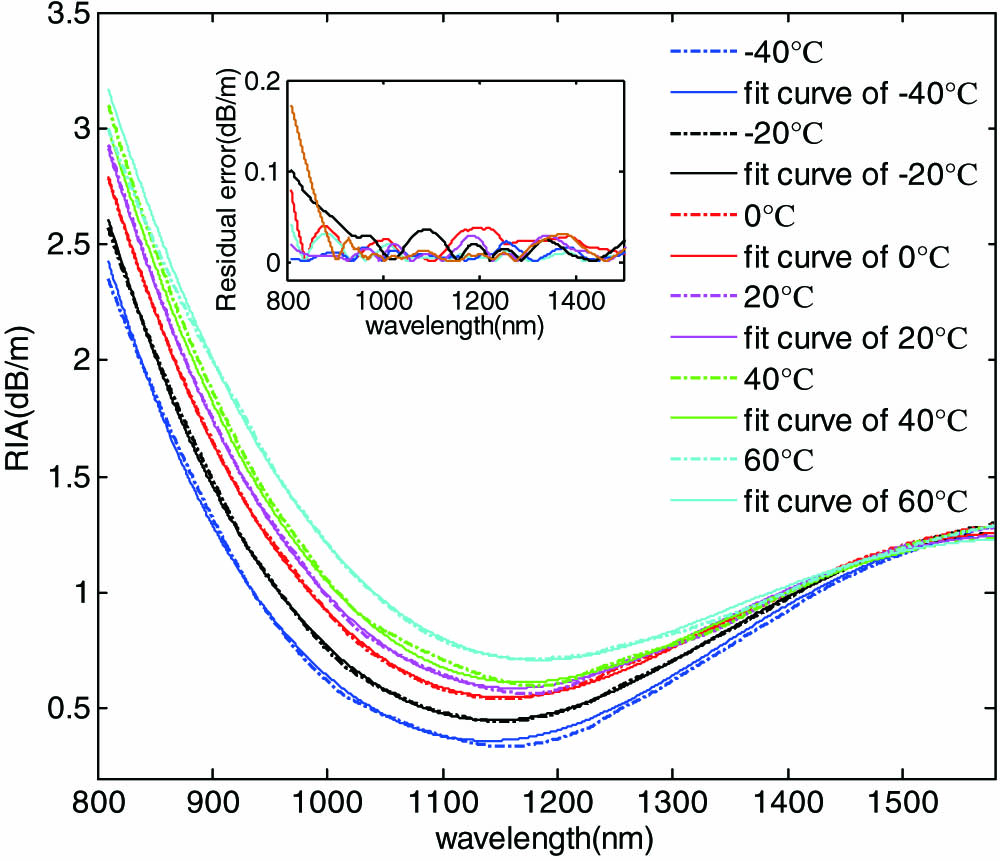
Fig. 1. Experimental data (dotted lines) and fitted curves (solid lines) of the RIA spectra at six temperatures. The inset shows the residual errors between the experimental data and the fitted curves.
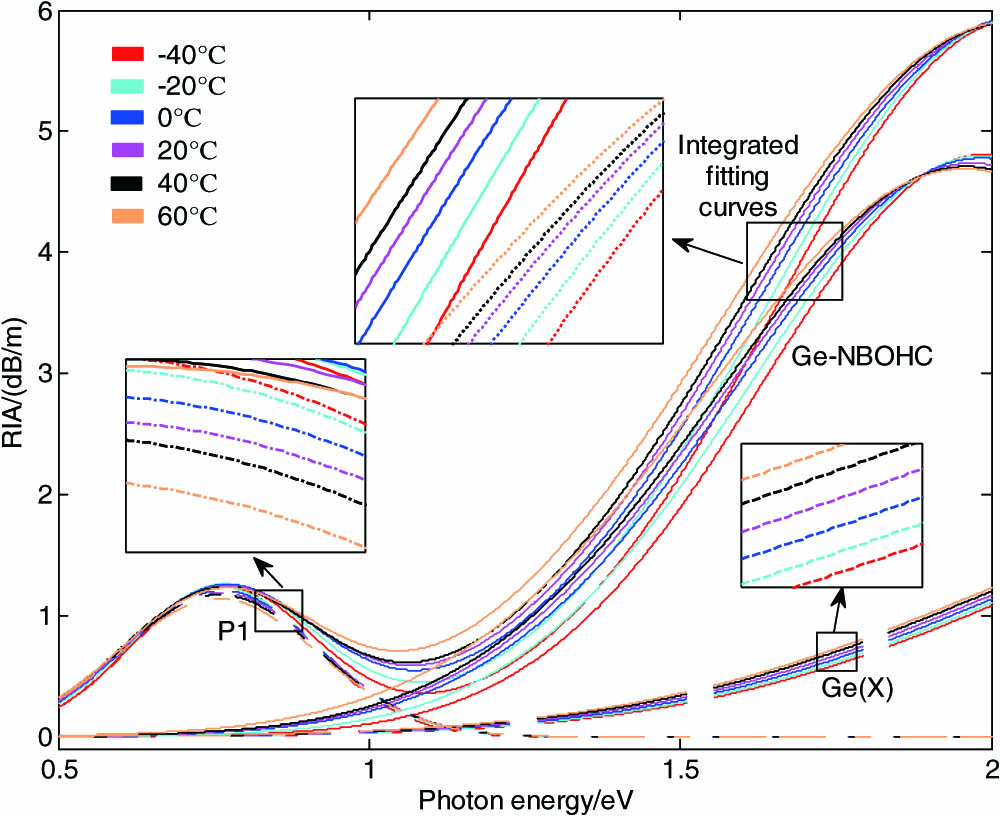
Fig. 2. Absorption bands (dotted lines) of P1, Ge-NBOHC, and Ge(X) color centers at six temperatures and their integrated fitted curves. The inset shows the partial enlargement of the curves.
Fig. 3. Linear fitted curves of parameters a ( T ) E ( T ) ω ( T )
Fig. 4. Experimental data and simulation results at 850, 1310, and 1550 nm. The values of the MSE between the simulation and the test are shown.
|
Table 1. Main Parameter Values of P1, Ge-NBOHC, Ge(X) Color Centers
|
Table 2. Parameter Values of P1 Color Centers
|
Table 3. Parameter Values of Ge-NBOHC Color Centers
|
Table 4. Parameter Values of Ge(X) Color Centers
| |||||||||||||||||||||||||||||||||||||||||||||||||
Table 5. Coefficients of the Fitting Functions of an, En, and ωn
|
Table 6. Sensitivity and Nonlinearity of Temperature-Dependent RIA at Three Wavelengths

Set citation alerts for the article
Please enter your email address
© Copyright 2018-2021 | Chinese Laser Press. All Rights Reserved 沪ICP备15018463号-20