Jing Jin, Chunjing Liu, Jixun Liu, Yunxia Hou, "Modeling and analyzing the temperature sensitivity of radiation-induced attenuation in a Ge-P co-doped fiber," Chin. Opt. Lett. 14, 030601 (2016)
Copy Citation Text
A model for the temperature sensitivity of radiation-induced attenuation (RIA) is investigated. The RIA spectra in a germanium (Ge) and phosphorous (P) co-doped fiber ranging from 825 to 1600 nm at different temperatures are measured and decomposed according to the configurational coordinate model. It is found that there is a linear relationship between the parameters of the color center absorption band and temperature. The model is verified at 850, 1310, and 1550 nm by both simulation and experiment. This work will be useful to research on the applications of optical fiber sensors in a complicated space environment.
In space radiation environment, the attenuation in optical fibers will increase, namely radiation-induced attenuation (RIA), which is the main influencing factor of the performances of optical fiber systems[1,2]. The space where optical fiber sensors work is a very complex and variable-temperature environment, and the RIA in optical fibers changes with the varying temperatures[1,3–5]. This instability of the RIA in optical fibers will further influence the performances of fiber optic gyroscopes. Research related to the temperature characteristics of the RIA in fibers has been going on for several decades. Various studies have demonstrated that irradiation would result in RIA due to the color center absorption in fibers[6–9]. Color centers in optical fibers are essentially point defects that can induce light absorption[5], and their concentration can affect the induced attenuation[10]. They can be divided into two categories under certain temperature conditions: stable ones and unstable ones. Stable color centers would remain unchanged indefinitely, whereas unstable ones would decompose or transform into others during thermal annealing[11–13]. The RIA in some optical fibers is very sensitive to temperature, and its temperature dependence exhibits good repeatability after sufficient annealing[14,15]. A preliminary discussion based on experimental phenomena has been reported in Ref. [16] to investigate the influences of total radiation dose, light-source power, and operating wavelength on its temperature dependence.
A physical model called the configurational coordinate model was introduced briefly. This model can interpret the spectrum properties of the temperature-dependent RIA with the absorption spectrum of color centers. It has already been applied to P1 color centers to explain the temperature-dependent RIA in phosphorous (P)-doped fibers[17]. It is found that the RIA spectrum can be decomposed into several absorption bands of color centers. The absorption spectrum of color centers is in a Gaussian band shape, whose parameters can be affected by temperature. In the Letter, we adopted a quantitative analysis method to study the relationship between these parameters and temperature. It is firstly found that these parameters change linearly with the increasing temperature. A model for the temperature sensitivity of the RIA in a germanium (Ge) and P co-doped fiber has been built. The model can help explain the temperature dependence of RIA with the temperature dependence of the color centers’ parameters. By simulation and experiment, we verified the model. The modeling method can be generalized to be applied to different fibers. The work will contribute to evaluating the performance of optical fiber devices applied in radiation and varying-temperature environments.
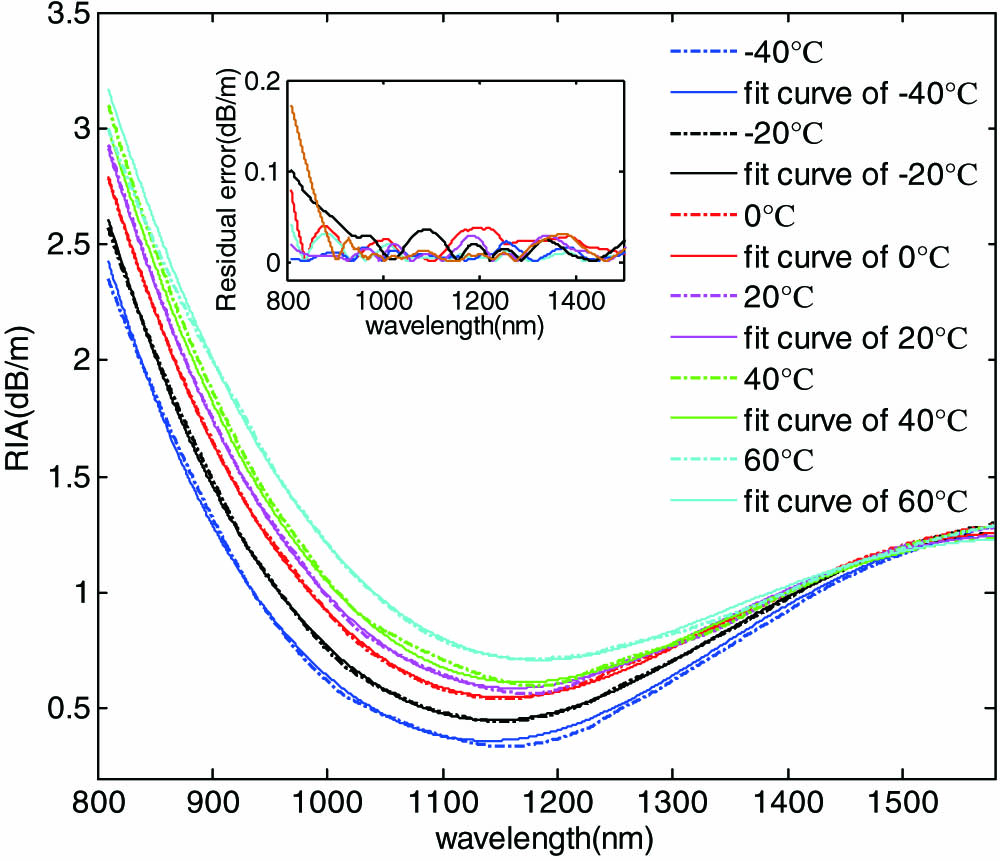
The test fiber (F1) is Ge and P co-doped in its core. Its core diameter is 10 μm, and its cladding and coating diameters are 80 and 165 μm. A gamma radiation source was adopted. The fiber (F1) was irradiated up to a total dose of 10000 Gy. After being annealed for a few weeks at room temperature, fiber F1 was placed into a temperature-controlled chamber for the purpose of accelerating the annealing process of the color centers. The thermal annealing temperature was 80°C. Finally, fiber F1 was annealed sufficiently, which meant that most of the unstable color centers had been decomposed or transformed into other ones[13]. However, all the color centers may be bleached and made unstable by using a sufficiently high temperature. Thus, all the analysis and experiments in this Letter were carried out in a specific temperature range. Then, the RIA spectra ranging from 825 to 1600 nm in fiber F1 were measured at , , 0°C, 20°C, 40°C, and 60°C with an optical spectrum analyzer. The broken lines shown in Fig. 1 are the RIA spectra smoothed by a 300-point Savitzky–Golay smooth of the experimental data, which illustrates that the RIA increases monotonously with increasing temperature in the spectral range of 825–1100 nm (1.13–1.50 eV). Two consecutive tests show consistent results, which means that the color centers in the test fiber were hardly bleached by the thermal treatment. Figure 1 also gives the fitted curves of the RIA spectra and the residual errors between the experimental data and the fitted curves.
Sign up for Chinese Optics Letters TOC. Get the latest issue of Chinese Optics Letters delivered right to you!Sign up now
Figure 1.Experimental data (dotted lines) and fitted curves (solid lines) of the RIA spectra at six temperatures. The inset shows the residual errors between the experimental data and the fitted curves.
Previous investigations indicate that the color center in an irradiated fiber can be coupled to the vibration lattice, and its absorption band is Gaussian-like[5,17]. The configurational coordinate model can be used to analyze the spectrum properties of the color centers[18–21]. According to this model, with an increasing temperature the peak of absorption spectrum will shift to a lower energy region and the bandwidth will widen[19]. The fitting function is shown as[17]where represents the photon energy; , , and denote Planck’s constant, the velocity of light, and the operating wavelength, respectively; , , and are determined by the color centers. is the peak point of the nth kind of color center absorption band. The parameter is the full width at half-maximum of the absorption band, and represents the absorption intensity.
The spectrum of temperature-dependent RIA in Ge-P co-doped fibers is mainly influenced by the color centers associated with Ge and P at UV and near-infrared wavelengths[6,17,22]. Among the color centers associated with P, POHC and P1 show significant effects on the induced attenuation. However, the stable temperature of POHC is low, and POHC would rapidly decay and partly transform into P1 if the temperature increased[17]. Thus, the amount of POHC is very small in the irradiated fiber after being sufficiently thermally annealed, and it can be neglected. For the optical absorption bands of Si-NBOHC at UV and near-infrared wavelengths, is about 2 eV, and is 0.18 eV. Due to its narrow absorption bandwidth, the impact of the light absorption of Si-NBOHC on the spectrum below 1.5 eV is very weak. Therefore, we did not take Si-NBOHC into consideration[22]. In our research, it was found that the RIA spectra ranging from 825 to 1600 nm in Ge-P co-doped fibers could be decomposed into three kinds of color center absorption bands, namely P1, Ge-NBOHC, and Ge(X). Thus, the fitting function of RIA could be expressed as Two parameters of color centers that were used in our study are shown in Table 1. All the values are obtained at 20°C[17,22–24]. The two parameters only depend on the kinds of color centers and the temperature.
Color center name
En (eV)
ωn (eV)
P1
0.765
0.224
Ge-NBOHC
1.97
0.3–0.6
Ge(X)
2.61
0.82
Table 1. Main Parameter Values of P1, Ge-NBOHC, Ge(X) Color Centers
According to the configurational coordinate model, when the temperature increases, the values of and will decrease, and the value of will increase. According to Eq. (3), the relationship between the three parameters and temperature determines the temperature dependence of RIA. Thus, , and were studied in the Letter.
To acquire the fitted curves of the RIA spectra, we placed the parameter values of P1, Ge-NBOHC, and Ge(X) into Eq. (3) separately. The parameters’ values may have slight fluctuations compared with these showed in Table 1 during the course of the fitting. Figure 2 gives the absorption bands (dotted lines) of the P1, Ge-NBOHC, and Ge(X) color centers at six temperatures and their integrated fitted curves. Partial enlargements of these curves are also shown in Fig. 2. It is obvious that the fitted curves coincide well with the experimental data with small residual errors, as shown in Fig. 1. Figures 1 and 2 illustrate that the wavelength dependence of the temperature-dependent RIA can be interpreted by the configurational coordinate model exactly.
Figure 2.Absorption bands (dotted lines) of P1, Ge-NBOHC, and Ge(X) color centers at six temperatures and their integrated fitted curves. The inset shows the partial enlargement of the curves.
Eventually, the parameters’ values of the three kinds of color center absorption bands at six temperatures were obtained. All the values are shown in Tables 2–4. In order to study the relationship between these nine parameters and temperature quantitatively, we described , , and with their fitted curves, as shown in Fig. 3. Figure 3 illuminates that these parameters and temperature are in a linear relationship. Table 5 gives the coefficients of each linear fitted function of , , and , as well as their squares.
Provided that the color centers in fiber F1 remain stable, the RIA spectrum as well as the color center absorption bands at any temperature, not only but also below or over 60°C, can be fitted by using linear fitted functions of the parameters and Eq. (3). Furthermore, the RIA values of different operating wavelengths () at any temperature () can be obtained by using Eq. (4), which can be considered as the model for the temperature sensitivity of the RIA in fiber F1: According to the model for temperature sensitivity of the RIA, namely Eq. (4), we can easily obtain the temperature and spectra characteristics of the RIA in fiber F1, which allows us to perform the analysis of the temperature sensitivity at a certain wavelengths. In this part, the RIA ranging from to 100°C at 850, 1310, and 1550 nm, which are commonly used wavelengths of optical communication, were simulated by using Eq. (4). In order to verify the model for the temperature sensitivity of the RIA, the RIA in fiber F1 at 850 nm (1.46 eV), 1310 nm (0.95 eV), and 1550 nm (0.8 eV) were measured. The RIA was tested at several different temperatures (−50°C–80°C with an interval of 10°C).
Figure 4 gives both the experimental data and the simulated result. The values of the mean squared error (MSE) between simulation and test at 850, 1310, and 1550 nm are , , and , respectively. These small MSE values show that the agreement between the test and simulation is good, and the temperature behaviors of RIA at the three wavelengths are well simulated by the obtained parameters in Tables 2–4. In other words, the quality of our fitting in Figs. 1 and 2 is very good. In Fig. 4, it can be seen that not only the RIA measurements in the range of −40°C to 60°C, but also that the RIA measurements at −50°C, 70°C, and 80°C are almost consistent with the simulated results, which means that the model is applicable over a wider temperature range than −40°C–60°C. The highest temperature of the temperature range is mainly determined by the annealing temperature (80°C), as most of the unstable color centers have been decomposed or transformed into other kinds of color centers that remain unchanged below the thermal annealing temperature[11–13]. Therefore, the temperature range can be extended up to a higher temperature through increasing the annealing temperature. However, color centers that remain stable previously may be decomposed or transform into others when the annealing temperature increases, and the model based on previously unchanged color centers will be invalid under this condition.
Figure 4.Experimental data and simulation results at 850, 1310, and 1550 nm. The values of the MSE between the simulation and the test are shown.
A generalized model for the temperature sensitivity of the RIA in different fibers can be built based on our investigation, and is expressed as where represents the total kinds of contributing color centers in the fiber, and , , and represent parameters of the th kind of color center absorption band. The temperature range is mainly determined by the thermal annealing temperature. The model in the target fiber can be built based on the method adopted in this Letter. The method is summarized as follows.
First, the RIA spectra of the target fiber, which had been irradiated and sufficiently annealed, were measured at several temperatures. Then, the measured RIA spectra were smoothed to eliminate the noise spike. Second, we estimated the kinds of contributing color centers in the fiber based on the existing research results. In order to obtain the fitted curves, we modified the parameters , , and depending on the known values at each temperature. In this way, the parameters’ values at different temperatures can be acquired. Finally, we analyzed the relationship between these parameters and temperature quantitatively. The model can be obtained by putting the fitting functions , , and of each kind of color center into Eq. (5). The method will help us to analyze the temperature- dependent RIA in optical fibers from the aspect of color center absorption. By using the model we can obtain the sensitivity and nonlinearity of the temperature-dependent RIA in the test fiber, as Table 6 shows. The temperature sensitivity at 850 nm is ; it is nearly 5 times that at 1310 nm, and almost 50 times that at 1550 nm. Besides, the nonlinearity between RIA and temperature at 850 nm is , which is smaller than that at 1310 and 1550 nm. The results indicate that 850 nm is more suitable for temperature-sensing applications.
Wavelength (nm)
Sensitivity (dB/m/°C)
Nonlinearity (%)
850
7.77×10⁻³
±2.14
1310
1.61×10⁻³
±2.66
1550
1.6×10⁻⁴
±9.23
Table 6. Sensitivity and Nonlinearity of Temperature-Dependent RIA at Three Wavelengths
This Letter presents an investigation into modeling for the temperature sensitivity of RIA. The RIA spectra in a Ge-P co-doped fiber with a total radiation dose of 10000 Gy ranging from 825 to 1600 nm at six different temperatures are measured. According to the configurational coordinate model, the RIA spectrum decomposes into three absorption bands corresponding to three kinds of color centers, P1, Ge-NBOHC, and Ge(X). The absorption band of the color centers is in a Gaussian band shape whose absorption intensity , peak position , and full width at half-maximum vary regularly with the increasing temperature. The values of the three kinds of color centers’ parameters at different temperatures are obtained by fitting the measured RIA spectra. We relate these parameters to temperature quantitatively and find that they are in a linear relationship. A model for the temperature sensitivity of the RIA is built; it will be useful in obtaining the temperature sensitivity at a certain wavelength. The model is verified at 850, 1310, and 1550 nm, and the agreement between the measured result and the simulated result is good. At the wavelength of 850 nm, the temperature sensitivity is higher and the nonlinearity is smaller than those at the other two wavelengths. Therefore, 850 nm is more suitable for temperature-sensing applications. The modeling method can be generalized, and a general model for the temperature sensitivity of the RIA in different fibers is built as Eq. (5). This investigation will contribute to research on the applications of optical fiber devices in a complicated space environment.
[11] B. Brichard, S. V. Ierschot, C. Hendrickx. Proceedings of Radiation and Its Effects on Components and Systems, 2007. RADECS 2007. 9th European Conference on IEEE, 1(2007).
Jing Jin, Chunjing Liu, Jixun Liu, Yunxia Hou, "Modeling and analyzing the temperature sensitivity of radiation-induced attenuation in a Ge-P co-doped fiber," Chin. Opt. Lett. 14, 030601 (2016)