• Photonics Research
  • Vol. 11, Issue 2, 173 (2023)
Yulong Cao1、2, Zhenghu Chang1, Qiang Wu1, Jingsheng Huang1, Laiyang Dang1, Ai Liu1, Yiyang Luo1, Ligang Huang1, Wei Huang1, Lei Gao1、3、*, and Tao Zhu1、4、*
Author Affiliations
  • 1Key Laboratory of Optoelectronic Technology & Systems (Ministry of Education), Chongqing University, Chongqing 400044, China
  • 2Department of Electrical and Electronic Engineering, The University of Hong Kong, Hong Kong, China
  • 3e-mail: gaolei@cqu.edu.cn
  • 4e-mail: zhutao@cqu.edu.cn
  • show less
    DOI: 10.1364/PRJ.478095 Cite this Article Set citation alerts
    Yulong Cao, Zhenghu Chang, Qiang Wu, Jingsheng Huang, Laiyang Dang, Ai Liu, Yiyang Luo, Ligang Huang, Wei Huang, Lei Gao, Tao Zhu. Self-synchronized temporal-spectral characterization system for revealing ultrafast fiber laser dynamics[J]. Photonics Research, 2023, 11(2): 173 Copy Citation Text show less
    Schematic representation of the SSTSC system. The single-shot spectrum of every round-trip output pulse will be mapped to the time domain by the DFT (in the green box). The soliton being tested as the input laser source generates the Raman frequency shift soliton with the same repetition rate at a longer wavelength band. The synchronous signal and pump overlap in the time domain and the FWM occurs in PTL to generate the magnification idler pulse to obtain the temporal information of the soliton being tested (in the yellow box).
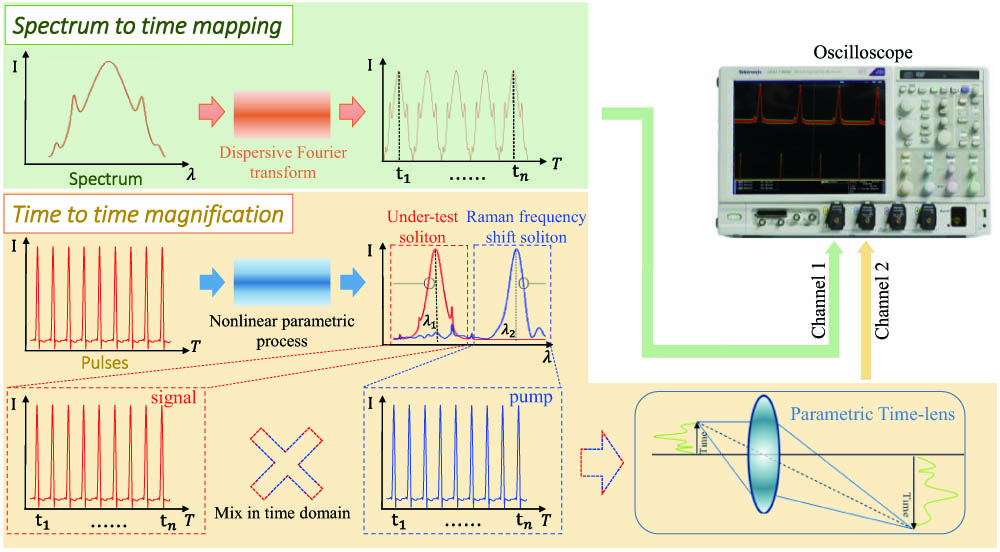
    Fig. 1. Schematic representation of the SSTSC system. The single-shot spectrum of every round-trip output pulse will be mapped to the time domain by the DFT (in the green box). The soliton being tested as the input laser source generates the Raman frequency shift soliton with the same repetition rate at a longer wavelength band. The synchronous signal and pump overlap in the time domain and the FWM occurs in PTL to generate the magnification idler pulse to obtain the temporal information of the soliton being tested (in the yellow box).
    Schematic diagram of our pulse and spectrum real-time measurement system. The green part is the specific composition and parameter diagram of the DFT system, while the yellow part is the time lens system. The blue solid line box is our Raman soliton frequency shift generator.
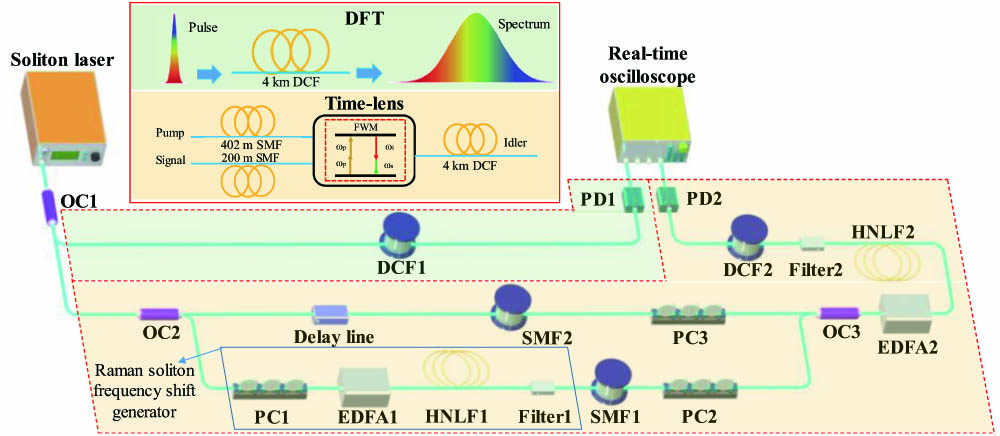
    Fig. 2. Schematic diagram of our pulse and spectrum real-time measurement system. The green part is the specific composition and parameter diagram of the DFT system, while the yellow part is the time lens system. The blue solid line box is our Raman soliton frequency shift generator.
    (a) Autocorrelation trace of the CS being tested. (b) Spectrum of the CS. (c) Pulse trains of the output laser from OC3. The inserted figure is a pair of overlapped signals and pump pulses in Fig. 3(c).
    Fig. 3. (a) Autocorrelation trace of the CS being tested. (b) Spectrum of the CS. (c) Pulse trains of the output laser from OC3. The inserted figure is a pair of overlapped signals and pump pulses in Fig. 3(c).
    (a) Average spectrum of the soliton laser and the output of the Raman soliton frequency shift generator. (b) Average spectrum of the overlapping signal and pump (in blue) and the amplified pump and signal (in red). (c) Average spectrum of the FWM and the output from Filter2.
    Fig. 4. (a) Average spectrum of the soliton laser and the output of the Raman soliton frequency shift generator. (b) Average spectrum of the overlapping signal and pump (in blue) and the amplified pump and signal (in red). (c) Average spectrum of the FWM and the output from Filter2.
    Spectral evolution of 3100 continuous measurement results of our CS from (a) the top view and (b) the front view. (c) Fluctuations of the spectral energy and bandwidth of 3100 continuous measurement results. Pulse evolution of 3100 continuous measurement results of our CS from (d) the top view and (e) the front view. (f) Fluctuations of the pulse energy and duration of the 3100 continuous measurement results.
    Fig. 5. Spectral evolution of 3100 continuous measurement results of our CS from (a) the top view and (b) the front view. (c) Fluctuations of the spectral energy and bandwidth of 3100 continuous measurement results. Pulse evolution of 3100 continuous measurement results of our CS from (d) the top view and (e) the front view. (f) Fluctuations of the pulse energy and duration of the 3100 continuous measurement results.
    (a) and (b) Real-time spectrum evolution of a CS build-up process. (c) and (d) Real-time pulse evolution of a CS buildup process. The multipulses are marked by white transparent lines.
    Fig. 6. (a) and (b) Real-time spectrum evolution of a CS build-up process. (c) and (d) Real-time pulse evolution of a CS buildup process. The multipulses are marked by white transparent lines.
    Yulong Cao, Zhenghu Chang, Qiang Wu, Jingsheng Huang, Laiyang Dang, Ai Liu, Yiyang Luo, Ligang Huang, Wei Huang, Lei Gao, Tao Zhu. Self-synchronized temporal-spectral characterization system for revealing ultrafast fiber laser dynamics[J]. Photonics Research, 2023, 11(2): 173
    Download Citation