• Acta Optica Sinica
  • Vol. 39, Issue 1, 0133001 (2019)
Min Huang*, Ruili He, Chunli Guo, Yonghui Xi, and Yu Liu
Author Affiliations
  • School of Printing and Packaging Engineering, Beijing Institute of Graphic Communication, Beijing 102600, China
  • show less
    DOI: 10.3788/AOS201939.0133001 Cite this Article Set citation alerts
    Min Huang, Ruili He, Chunli Guo, Yonghui Xi, Yu Liu. Discrimination of Observer Metamerism Based on Different Display Devices[J]. Acta Optica Sinica, 2019, 39(1): 0133001 Copy Citation Text show less
    Spectral power distributions of three primaries of display devices. (a) Red channel; (b) green channel; (c) blue channel
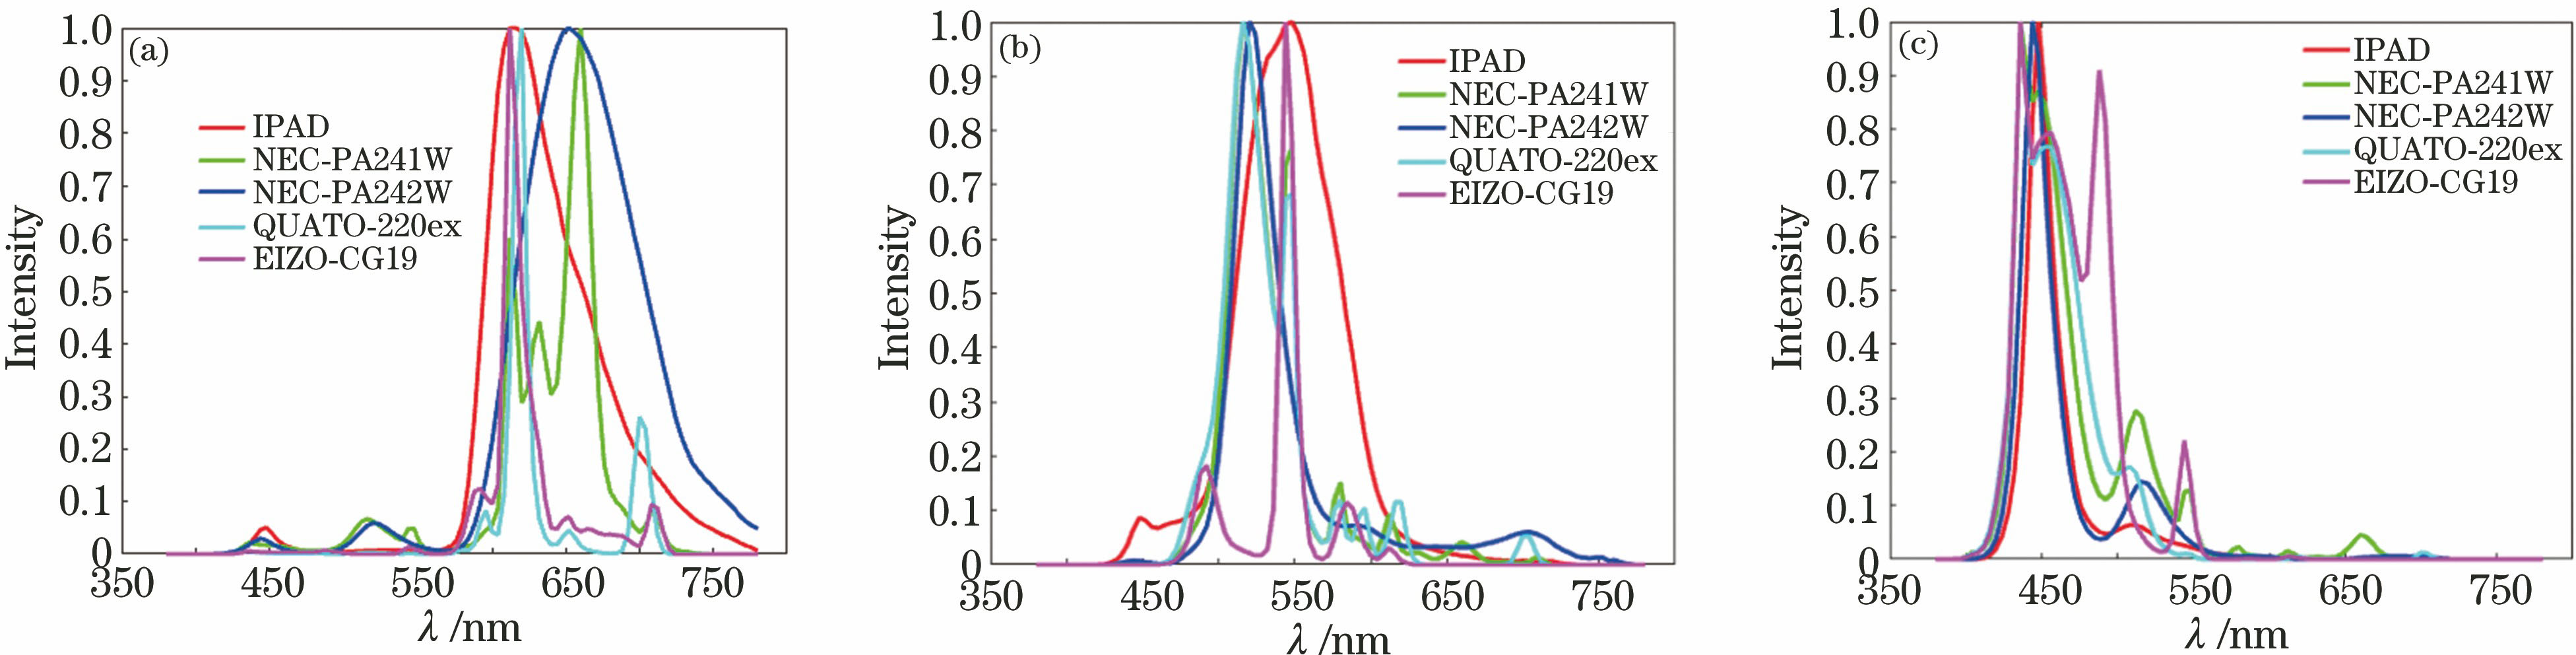
    Fig. 1. Spectral power distributions of three primaries of display devices. (a) Red channel; (b) green channel; (c) blue channel
    Color-matching experimental setup
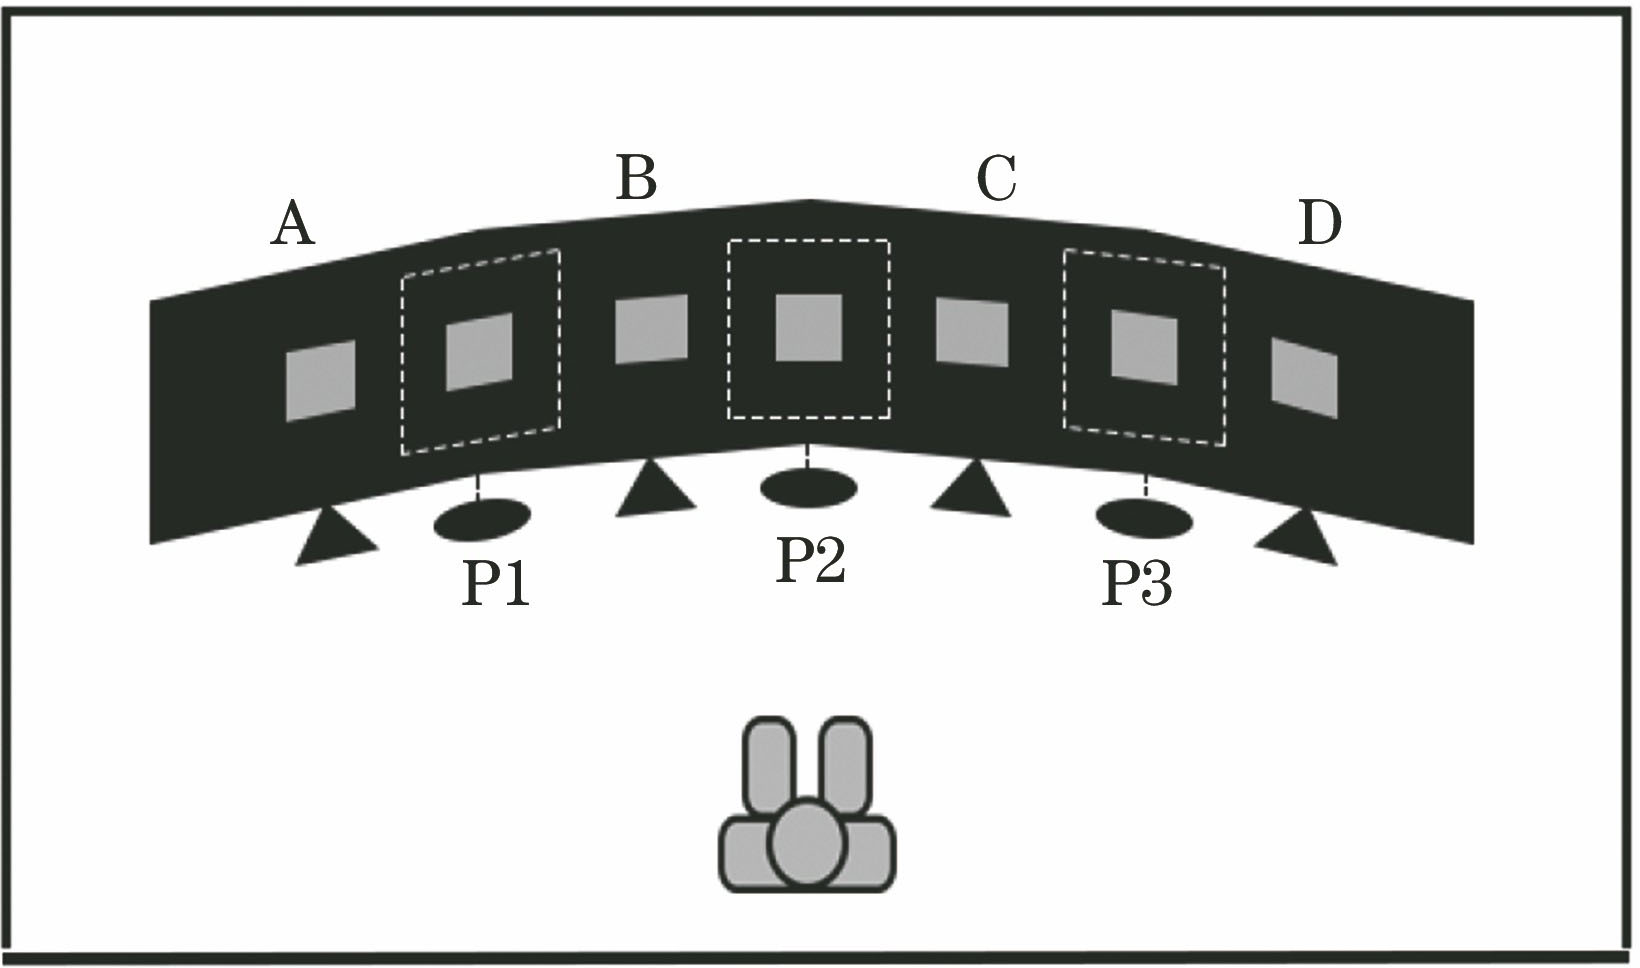
    Fig. 2. Color-matching experimental setup
    Spectral response curves of 108 color-matching functions
    Fig. 3. Spectral response curves of 108 color-matching functions
    Scattering distributions of matched data obtained by simulation based on different display devices. (a) a10*b10*plane; (b) L10*C10* plane
    Fig. 4. Scattering distributions of matched data obtained by simulation based on different display devices. (a) a10*b10*plane; (b) L10*C10* plane
    Scattering distributions of matched data obtained from color-matching experiment based on different display devices. (a) a10*b10*plane; (b) L10*C10* plane
    Fig. 5. Scattering distributions of matched data obtained from color-matching experiment based on different display devices. (a) a10*b10*plane; (b) L10*C10* plane
    Colorimetric ellipses of observers based on different display devices
    Fig. 6. Colorimetric ellipses of observers based on different display devices
    (a)(c)(e)(g)(i) Simulation results and (b)(d)(f)(h)(j) color-matching experimental results based on different display devices and target device (different color stimuli)
    Fig. 7. (a)(c)(e)(g)(i) Simulation results and (b)(d)(f)(h)(j) color-matching experimental results based on different display devices and target device (different color stimuli)
    No.DisplayLuminance /(cd·m-2)Correlated colour temperature /KTristimulus value (white points)Resolution /(pixel×pixel)
    XnYnZn
    1IPAD119.585038116.31117.58105.692048×1536
    2NEC-PA241W121.734996112.14119.0593.331920×1200
    3NEC-PA242W120.385012114.81120.2894.891920×1200
    4QUATO-220ex119.565053109.25117.2488.891920×1080
    5EIZO-CG19121.494989112.77117.0199.451280×1024
    Table 1. Specific parameters of display devices
    ChannelIPADNEC-PA241WNEC-PA242WQUATO-220exEIZO-CG19
    xyxyxyxyxy
    R0.640.330.60.340.640.330.660.330.650.34
    G0.350.570.250.680.260.680.240.670.330.61
    B0.150.080.150.130.160.100.140.090.140.13
    W0.340.350.340.370.350.370.350.370.340.35
    Table 2. Chromaticity coordinates of three primaries of display devices
    ColorCIE-recommended colorsTarget colorsΔEab*
    L1*a1*b1*C1*h1ab*L1*a1*b1*C1*h1ab*
    Gray62000063.0-0.50.60.8127.01.3
    Red44372343.631.945.937.723.344.331.72.0
    Yellow87-74747.598.488.6-6.946.346.898.41.8
    Green56-32032.0180.057.0-27.10.727.1178.55.0
    Blue365-3131.4279.137.13.1-31.131.2275.72.2
    Table 3. Colorimetric values of CIE-recommended colors and colors from target display device
    ConditionNo.1No.2No.3No.4 and No.5
    No.2No.3No.4No.5No.3No.4No.5No.4No.5
    SimulationOM¯8.108.429.503.910.911.744.813.852.826.55
    OMmax14.5612.7716.009.212.753.679.007.126.389.45
    ExperimentOM¯7.616.769.593.894.414.716.336.135.858.22
    OMmax15.3218.9820.7311.0812.8314.4115.1614.2419.5215.11
    Table 4. Indexes of observer metamerism based on different display devices
    ChannelPeak wavelength position /nm
    No.1No.2No.3No.4No.5
    R616660652620612
    G548516520516544
    B448436444436436
    Table 5. Peak wavelength positions of R/G/B channels of different display devices
    ItemNo.1No.2No.3No.4 and No.5
    No.2No.3No.4No.5No.3No.4No.5No.4No.5
    Gray7.406.3210.183.374.264.696.146.595.438.76
    Red6.144.827.413.314.674.494.775.554.465.74
    Yellow9.779.0510.104.694.685.087.866.557.278.97
    Green6.966.519.083.334.064.376.205.535.608.04
    Blue7.797.1111.174.754.374.926.716.456.509.61
    Mean7.616.769.593.894.414.716.336.135.858.22
    Table 6. Color-matching experimental results for different display devices and different color stimuli
    Min Huang, Ruili He, Chunli Guo, Yonghui Xi, Yu Liu. Discrimination of Observer Metamerism Based on Different Display Devices[J]. Acta Optica Sinica, 2019, 39(1): 0133001
    Download Citation