
Xuyi Zhang, Jiale Cao. Contour-Point Refined Mask Prediction for Single-Stage Instance Segmentation[J]. Acta Optica Sinica, 2020, 40(21): 2115001
- Acta Optica Sinica
- Vol. 40, Issue 21, 2115001 (2020)
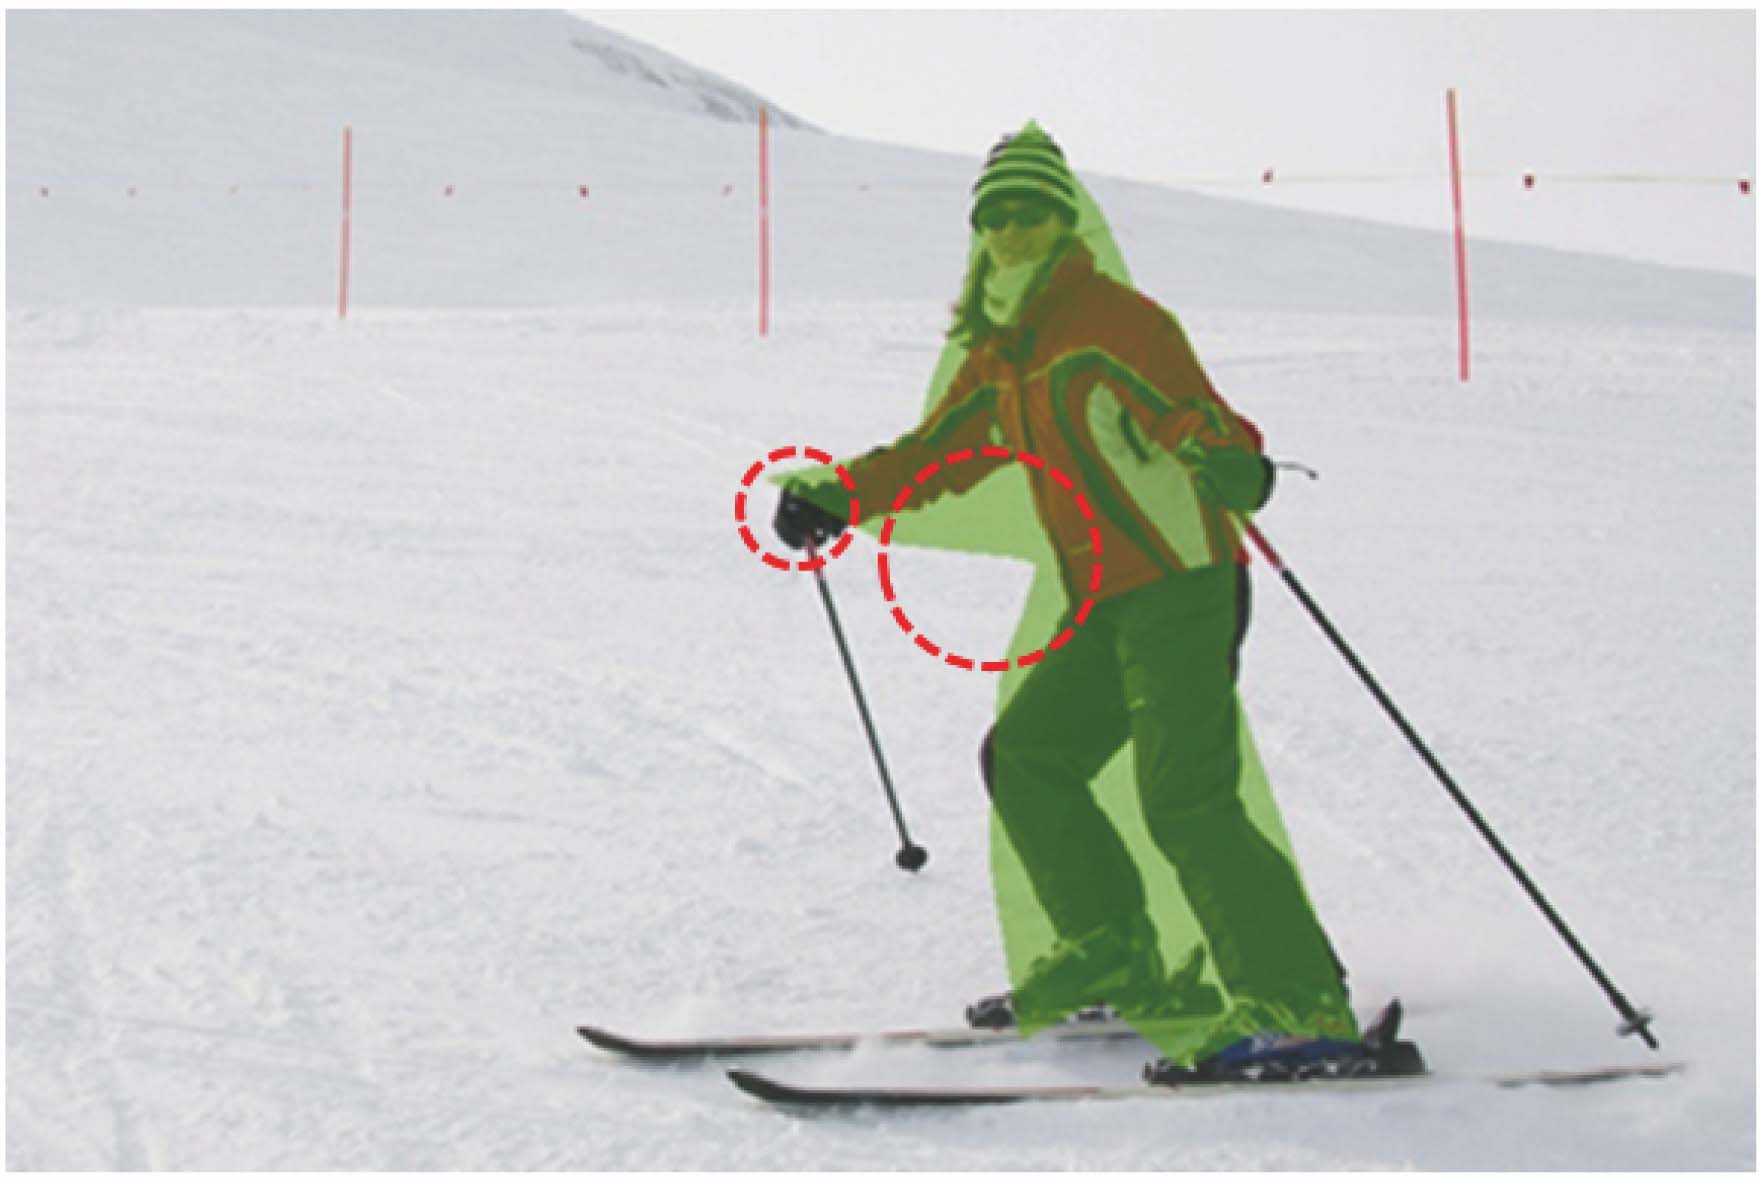
Fig. 1. PolarMask result visualization
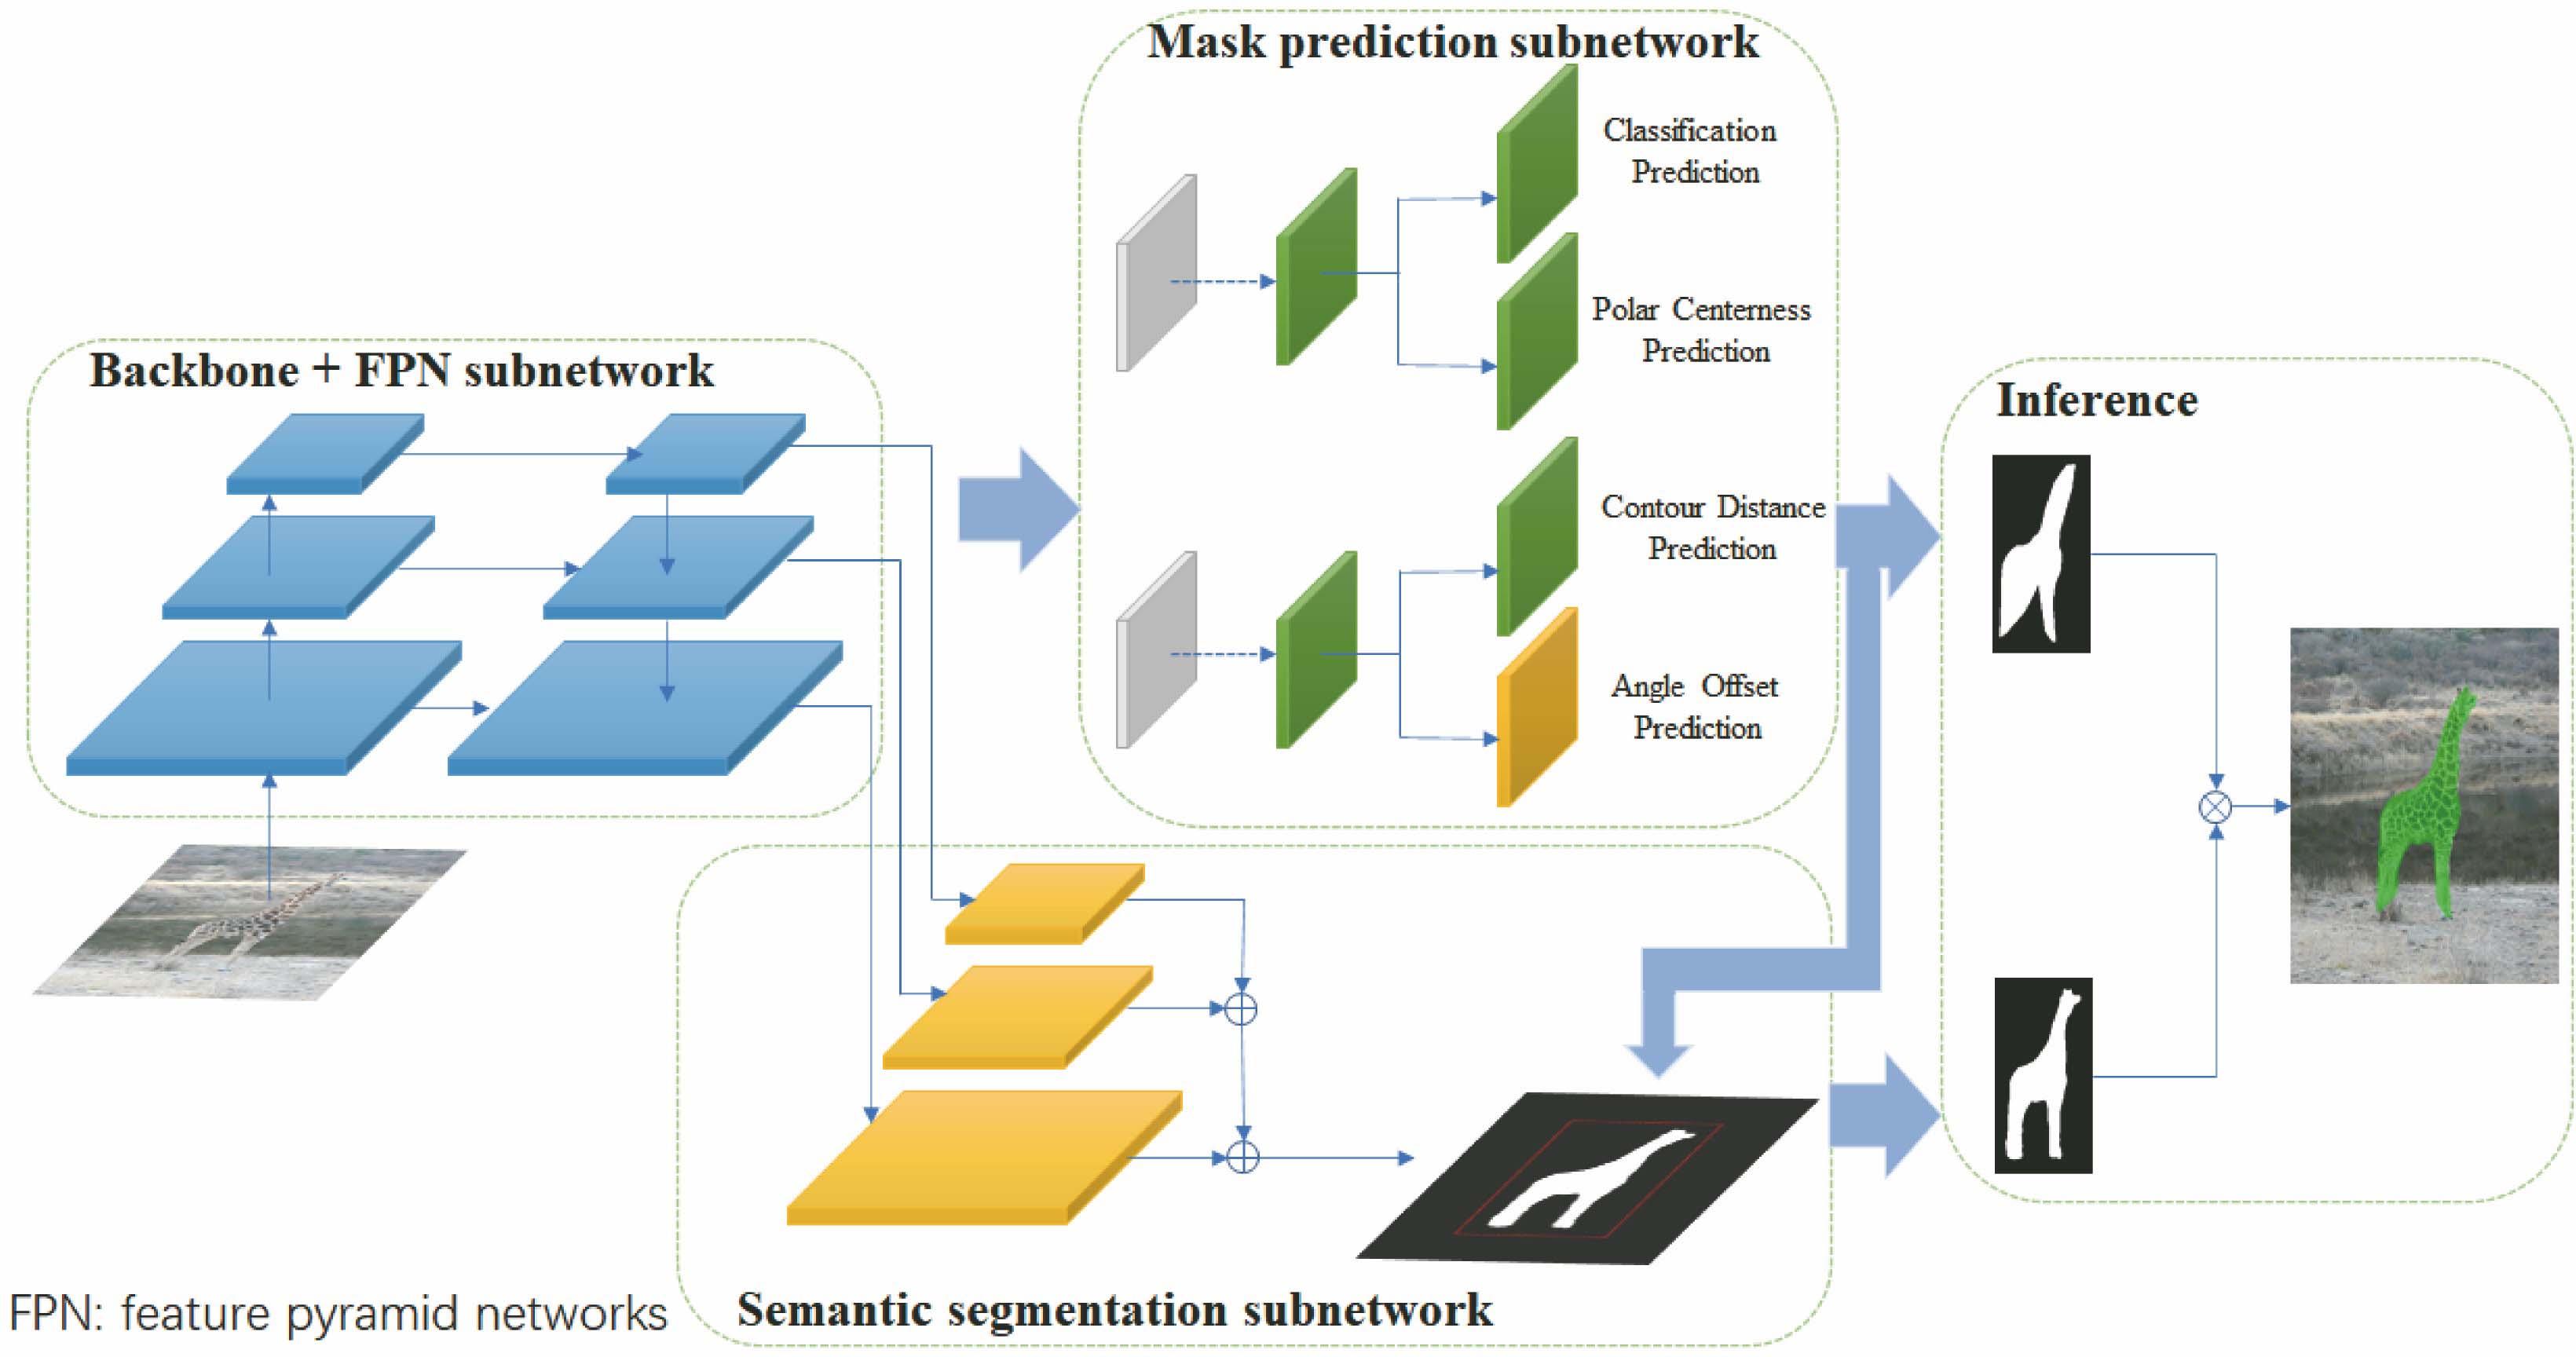
Fig. 2. Network architecture of our overall framework
Fig. 3. Polar coordinates of the contour points
Fig. 4. Semantic segmentation subnetwork
Fig. 5. Semantic segmentation of an image. (a) Original image; (b) semantic segmentation of area of concern
Fig. 6. Network structures of different mask prediction subnetworks. (a) Using different prediction subnetworks (DPS); (b) using the same prediction subnetwork (SPS)
Fig. 7. Segmentation results of each stage. (a) Original image; (b) segmentation results of semantic segmentation subnetwork; (c) segmentation results of mask prediction subnetwork; (d) final instance segmentation results
Fig. 8. Instance segmentation of different methods. (a) Original image; (b) PolarMask; (c) our method
Fig. 9. Results of the proposed algorithm under the MS COCO test dataset
|
Table 1. Comparison of semantic segmentation feature fusion methodsunit: %
|
Table 2. Comparison of experimental results of different mask prediction subnetworksunit: %
|
Table 3. Experimental results obtained by different loss function weightsunit: %
|
Table 4. Comparison of each module under MS COCO-validation datasetunit: %
|
Table 5. Performance comparison of different methods under the MS COCO test datasetunit: %

Set citation alerts for the article
Please enter your email address
© Copyright 2018-2021 | Chinese Laser Press. All Rights Reserved 沪ICP备15018463号-20