• Acta Optica Sinica
  • Vol. 43, Issue 18, 1899903 (2023)
Yuchang Xun1、2, Xuewu Cheng3, and Guotao Yang2、*
Author Affiliations
  • 1College of Physics and Optoelectronic Engineering, Taiyuan University of Technology, Taiyuan 030024, Shanxi, China
  • 2National Space Science Center, Chinese Academy of Sciences, Beijing 100190, China
  • 3Innovation Academy for Precision Measurement Science and Technology, Chinese Academy of Sciences, Wuhan 430071, Hubei, China
  • show less
    DOI: 10.3788/AOS231029 Cite this Article Set citation alerts
    Yuchang Xun, Xuewu Cheng, Guotao Yang. Detection of Atmospheric Metal Layer by Ground-Based Lidar[J]. Acta Optica Sinica, 2023, 43(18): 1899903 Copy Citation Text show less
    Excitation efficiency and spectral distribution of some dye substances
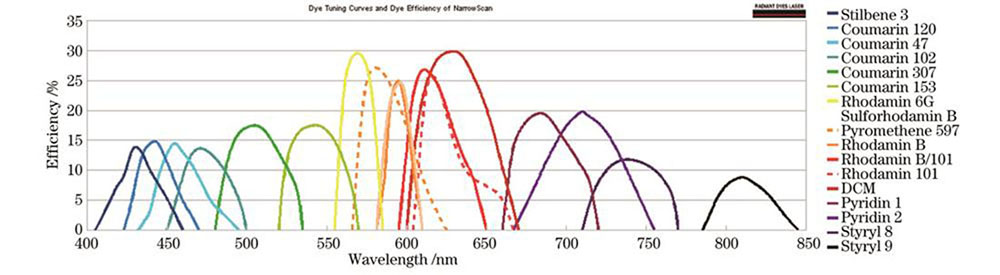
    Fig. 1. Excitation efficiency and spectral distribution of some dye substances
    Dual-wavelength lidar scheme and object picture in Yanqing station[14]. (a) Design scheme; (b) object picture
    Fig. 2. Dual-wavelength lidar scheme and object picture in Yanqing station[14]. (a) Design scheme; (b) object picture
    Design scheme and object picture of wind and temperature simultaneous measurement lidar in the middle and upper level for Meridian Project. (a) Design scheme; (b) object picture
    Fig. 3. Design scheme and object picture of wind and temperature simultaneous measurement lidar in the middle and upper level for Meridian Project. (a) Design scheme; (b) object picture
    Object pictures of all solid-state wind-temperature lidar realizing all-sky observation
    Fig. 4. Object pictures of all solid-state wind-temperature lidar realizing all-sky observation
    Design scheme and object picture of wind, temperature, and density simultaneous detection laser at Yanqing station[95]. (a) Design scheme; (b) object picture
    Fig. 5. Design scheme and object picture of wind, temperature, and density simultaneous detection laser at Yanqing station[95]. (a) Design scheme; (b) object picture
    Temperature and wind detection principle and inversion method[13]. (a)(b) Variation of sodium fluorescence spectra with temperature and wind speed; (c) two dimensional correction curves of temperature ratio and wind speed ratio
    Fig. 6. Temperature and wind detection principle and inversion method[13]. (a)(b) Variation of sodium fluorescence spectra with temperature and wind speed; (c) two dimensional correction curves of temperature ratio and wind speed ratio
    Research group(Year)Geographic locationPulse energy /mJTelescope diameter /mRef.
    Bowman et al.(1969)England Buckingham-Shire(50°N,7°W)-(Photons transmitted per pulse:1016)-(Receiver area:0.6 m2)[2]
    Hake et al.(1972)USACalifornia(40.2°N,88.2°W)5000.4[15]
    Megie et al.(1977)FranceHaute Provence Observatory(44°N)800-10000.818[16]
    Simonich et al.(1979)BrazilSão José dos Campos(54°N,12°E)20-(Receiver area:0.39 m2)[17]
    Richter et al.(1981)USAIllinois(40.2°N,88.2°W)100-(Receiver area:0.14 m2)[18]
    Juramy et al.(1981)USSRHeyss Island(30.5°N,114.3°E)10000.41[19]
    Nomura et al.(1987)AntarcticSyowa Station(69°S,39.6°E)2000.5[20]
    Gardner et al.(1989)USAHawaii(20°N,155°W)251.22[21]
    Shibata et al.(2006)IndonesiaKototabang(0.2°S,100.3°E)300.45[22]
    Prasanth et al.(2007)IndiaGadanki(13.5°N,79.2°E)250.75[23]
    Pfrommer et al.(2010)Canada/6(Focus on the effect of sodium atomic layer on adaptive optics system of very large telescope)[24]
    Kawahara et al.(2011)AntarcticSyowa Station(69°S,39°E)40/[25]
    Tsuda et al.(2011)NorwayTromsø(69.6°N,19.2°E)/0.355[26]
    Gong et al.(2003)ChinaWuhan Xiaohong Mountain(30.55°N,114.35°E)300.95[27]
    Yi et al.(2002)ChinaWuhan University(30.5°N,114.4°E)600.52[28]
    Dou et al.(2009)ChinaHefeiUniversity of Science and Technology of China(31.8°N,117.3°E)601[29]
    NSSC stationChinaBeijing Yanqing(40.5°N,116.0°E)401.23
    Hainan Normal University(20.0°N,110.5°E)401
    Andrioli et al.(2020)BrazilSão José dos Campos(23.1°S,45.9°W)601[30]
    Table 1. Sodium atom lidar parameters
    Research group(Year)Geographical locationPulse energy /mJTelescope diameter/ mRef.
    Granier et al.(1985)FranceObservatoire de Haute Provence(44°N,6°E)Ca:25Ca+:200.8[31]
    Gardner et al.(1993)USAUrbana Atmospheric Observatory(40.2°N,88.2°W)Ca:5Ca+:201[33]
    Qian et al.(1995)[34]
    Alpers et al.(1996)GermanJuliusru(54.5°N,13.4°E)Ca:15Ca+:120.8[35]
    Gerding et al.(2000)GermanKühlungsborn(54°N,12°E)Ca:22Ca+:175 or 7(1997)parabolic mirrors of 0.5 m diameter each[32]
    Tepley et al.(2003)USAArecibo(18.3°N,66.7°W)Ca:25Ca+:210.8[36]
    Raizada et al.(2004)[37]
    Yi et al.(2013)ChinaWuhan(30.5°N,114.3°E)Ca:20Ca+:251[38]
    Ejiri et al.(2019)JapanTachikawa(35.7°N,139.4°E)Ca+:120.83[39]
    NSSC stationChinaBeijing(40.5°N,116.0°E)Ca:30Ca+:301.2[40]
    Table 2. Calcium atom and ion lidar parameters
    Research group(Year)Geographical locationPulse energy /mJTelescope diameter /mRef.
    Granier et al.(1989)FranceObservatoire de Haute Provence(44°N,6°E)150.8[45]
    Chu et al.(2002)the North and South Poles100/(aperture area:0.13 m2)[48]
    Raizada et al.(2002)USAArecibo(18.3°N,66.7°W)/0.8[47]
    Shibata et al.(2006)IndonesiaKototabang(0.2°S,100.3°E)130.45[22]
    Yi et al.(2009)ChinaWuhan(30.5°N,114.3°E)401[50]
    Table 3. Iron atom lidar parameters
    Research group(Year)Geographical locationPulse energy /mJTelescope diameter /mRef.
    von Zahn and Höffner(1996)GermanJuliusru(54.5°N,13.4°E)1000.8[80]
    Eska et al.(1999)GermanKühlungsborn(54°N,12°E)1500.8[82]
    Friedman et al.(2002)USAArecibo(18.3°N,66.7°W)1000.8[84]
    Jiao et al.(2017)ChinaBeijingYanqing(40.5°N,116.0°E)451.0[87]
    Andrioli et al.(2020)BrazilSão José dos Campos(23.1°S,45.9°W)831.0[30]
    Table 4. Potassium atom lidar parameters
    Yuchang Xun, Xuewu Cheng, Guotao Yang. Detection of Atmospheric Metal Layer by Ground-Based Lidar[J]. Acta Optica Sinica, 2023, 43(18): 1899903
    Download Citation