Author Affiliations
1School of Environment, Nanjing Normal University, Nanjing 210023, China2Jiangsu Center for Collaborative Innovation in Geographical Information Resource Development and Application, Nanjing 210023, Chinashow less
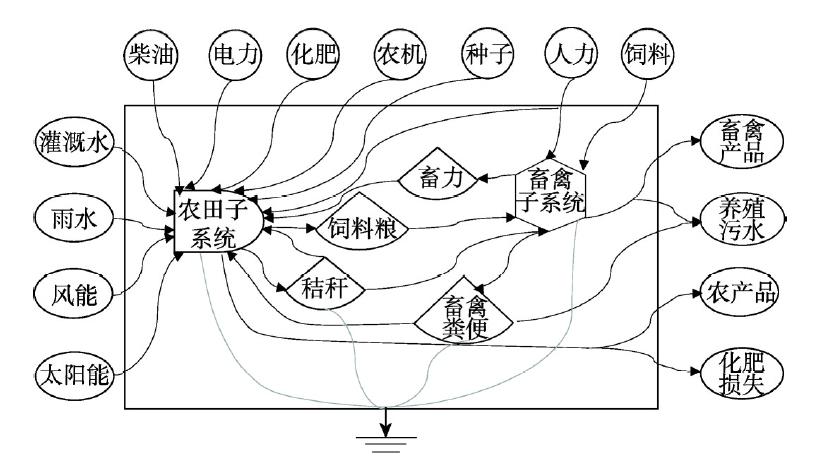
Fig. 1. Energy flow diagram of farmland-livestock production system in Dehua county
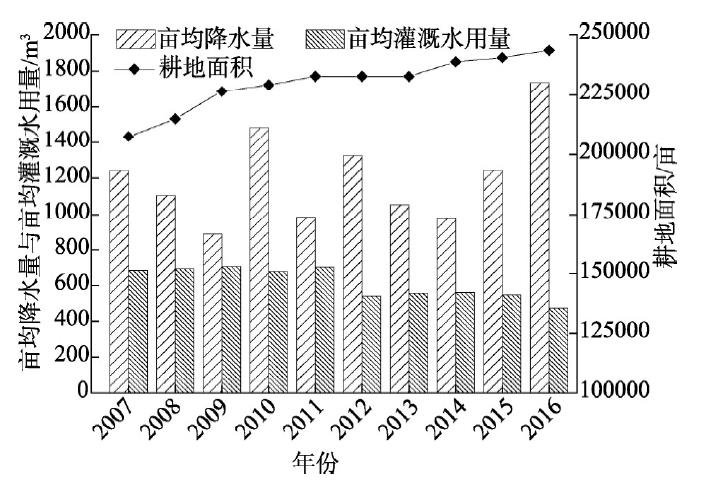
Fig. 2. Changes in farmland water use and cultivated land area in Dehua county from 2007 to 2016
Fig. 3. Relationship between seed emergy input and per capita net income of farmers in Dehua county
Fig. 4. Changes in output structure of farmland-livestock production system in Dehua county from 2007 to 2016
Fig. 5. Environmental pollution negative output and net output change of farmland-livestock production system in Dehua county from 2007 to 2016
Fig. 6. Changes of emergy comprehensive index of farmland-livestock production system in Dehua county from 2007 to 2016
| 评价指标 | 表达式 | 指标含义 |
|---|
| 可更新环境资源 | R | 反映本地无偿使用的可更新自然资源投入 | | 不可更新环境资源 | N | 反映本地无偿使用的不可更新自然资源投入 | | 购买资源能值 | F | 反映来自系统外部的经济投入 | | 能值转换率(UEV) | U/I | 反映系统对资源的利用效率 | | 净能值产出率(EYR) | (Y-Y*)/ F | 反映系统的生产效率和市场竞争力 | | 能值投资率(EIR) | F/(R+N) | 反映系统购买资源所占比例和自给程度 | | 人均能值用量(EPP) | U/P | 反映人民生活水平 | | 能值密度(ED) | U/A | 反映资源投入的大小和利用强度 | | 环境负载率(ELR) | (N+F)/R | 衡量系统环境压力的大小 | | 可持续发展指数(ESI) | EYR/ELR | 衡量系统生产的可持续发展能力 | | 可持续发展综合指数(EISD) | EYR×EER/ELR | 反映系统的可持续发展综合效益 | | 改进的可持续发展综合指数 | EYR×EER/(ELR×WER) | 兼顾经济效益和环境影响的可持续发展指标 |
|
Table 1. Comprehensive indicator system of farmland-livestock production system in Dehua county
| 类型 | 能量折算系数/(J/kg) | 能值转换率/(seJ/J或sej/g) | 类型 | 能量折算系数/(J/kg) | 能值转换率/(seJ/J或sej/g) |
|---|
| 灌溉水 | 4.94E+03 | 2.19E+05 | 饲料 | — | 8.61E+11 | | 土壤有机质 | 2.09E+04 | 9.40E+04 | 稻谷 | 1.51E+07 | 1.06E+05 | | 氮肥 | — | 5.87E+09 | 甘薯 | 4.20E+06 | 1.06E+05 | | 磷肥 | — | 2.26E+10 | 马铃薯 | 3.80E+06 | 1.06E+05 | | 钾肥 | — | 2.21E+09 | 茶叶 | 1.63E+07 | 2.54E+05 | | 复合肥 | — | 3.56E+09 | 水果 | 3.30E+06 | 6.74E+05 | | 农药 | — | 2.06E+09 | 蔬菜 | 2.50E+06 | 3.43E+04 | | 农膜 | — | 4.83E+08 | 瓜果 | 2.46E+06 | 3.13E+05 | | 农机 | — | 8.57E+09 | 食用菌 | 2.50E+06 | 3.43E+04 | | 柴油 | 4.40E+07 | 8.39E+04 | 猪肉 | 2.00E+07 | 2.16E+06 | | 电力 | 3.60E+06 | 2.02E+05 | 牛肉 | 9.00E+06 | 5.08E+06 | | 人力 | 3.50E+09 | 4.83E+05 | 羊肉 | 1.28E+07 | 2.54E+06 | | 畜力 | 1.89E+09 | 1.86E+05 | 禽肉 | 5.50E+06 | 2.54E+06 | | 有机肥 | 1.35E+07 | 3.43E+04 | 兔肉 | 5.20E+06 | 5.08E+06 | | 种子 | / | 8.61E+11 | 禽蛋 | 8.40E+06 | 2.17E+06 |
|
Table 2. Main input-output energy conversion coefficient and transformity of farmland-livestock production system
| 主要农作物类型 | 稻谷 | 甘薯 | 马铃薯 | 蔬菜 |
|---|
| 秸秆籽粒比 | 0.93 | 0.86 | 0.46 | 0.10 | | 籽粒作饲料比例/% | 30.70 | 67.50 | 28.30 | 23.30 | | 秸秆还田比例/% | 39.88 | 44.07 | 44.07 | 44.07 |
|
Table 3. Main crop production and consumption related parameters
| 畜禽养殖类型 | 猪 | 牛 | 羊 | 兔 | 鸡 | 鸭 |
|---|
| 粪便年排泄量/kg | 730 | 7300 | 547.5 | 100.58 | 18.25 | 54.75 | | 尿液年排泄量/kg | 1100 | 3650 | 274 | — | — | — | | 粪便有机质含量/% | 15.0 | 14.5 | 28.0 | 28.0 | 25.5 | 26.2 | | 尿液有机质含量/% | 2.5 | 3.0 | 7.2 | — | — | — | | 粪尿还田比例/% | 18.0 | 27.0 | 11.5 | 27.0 | 11.0 | 11.0 |
|
Table 4. Relevant parameters of feces and urine returning from livestock and poultry subsystems
| 参数类型 | 数值 | 参数类型 | 数值 |
|---|
| 化肥利用率/% | 35.20 | 养殖污水排放系数/(kg/头/天) | 15.38 | | 养殖污水COD含量/(mg/L) | 17808 | COD单位治理成本/(元/t) | 1875.60 | | 养殖污水BOD含量/(mg/L) | 4000 | BOD单位治理成本/(元/t) | 385 | | 养殖污水氨氮含量/(mg/L) | 524 | 氨氮单位治理成本/(元/t) | 468.90 |
|
Table 5. Main calculation parameters of farmland production and livestock and poultry farming pollution
| 项目 | 2007年 | 2008年 | 2009年 | 2010年 | 2011年 | 2012年 | 2013年 | 2014年 | 2015年 | 2016年 |
|---|
| 太阳能 | 8.40E+13 | 9.16E+13 | 1.00E+14 | 9.10E+13 | 9.79E+13 | 8.99E+13 | 1.07E+14 | 1.06E+14 | 9.29E+13 | 8.59E+13 | | 风能 | 1.25E+15 | 1.25E+15 | 1.25E+15 | 1.25E+15 | 1.25E+15 | 1.25E+15 | 1.25E+15 | 1.25E+15 | 1.25E+15 | 1.25E+15 | | 雨水势能 | 3.10E+15 | 2.76E+15 | 2.22E+15 | 3.71E+15 | 2.46E+15 | 3.32E+15 | 2.63E+15 | 2.44E+15 | 3.11E+15 | 4.34E+15 | | 雨水化学能 | 2.13E+15 | 1.89E+15 | 1.52E+15 | 2.55E+15 | 1.69E+15 | 2.28E+15 | 1.81E+15 | 1.68E+15 | 2.14E+15 | 2.98E+15 | | 地球旋转能 | 4.37E+14 | 4.37E+14 | 4.37E+14 | 4.37E+14 | 4.37E+14 | 4.37E+14 | 4.37E+14 | 4.37E+14 | 4.37E+14 | 4.37E+14 | | 灌溉水 | 5.96E+15 | 5.94E+15 | 5.55E+15 | 5.36E+15 | 5.06E+15 | 3.88E+15 | 4.02E+15 | 3.98E+15 | 3.92E+15 | 3.38E+15 | | 可更新资源合计 | 9.06E+15 | 8.70E+15 | 7.77E+15 | 9.08E+15 | 7.52E+15 | 7.20E+15 | 6.65E+15 | 6.42E+15 | 7.04E+15 | 7.72E+15 | | 表土损失能 | 1.74E+14 | 1.74E+14 | 1.74E+14 | 1.74E+14 | 1.74E+14 | 1.74E+14 | 1.74E+14 | 1.74E+14 | 1.74E+14 | 1.74E+14 | | 不可更新资源合计 | 1.74E+14 | 1.74E+14 | 1.74E+14 | 1.74E+14 | 1.74E+14 | 1.74E+14 | 1.74E+14 | 1.74E+14 | 1.74E+14 | 1.74E+14 | | 氮肥 | 1.82E+15 | 1.48E+15 | 1.41E+15 | 1.33E+15 | 1.33E+15 | 6.34E+14 | 1.34E+15 | 1.31E+15 | 1.34E+15 | 1.33E+15 | | 磷肥 | 2.56E+15 | 2.06E+15 | 2.20E+15 | 2.26E+15 | 2.27E+15 | 2.27E+15 | 2.32E+15 | 2.28E+15 | 2.33E+15 | 2.36E+15 | | 钾肥 | 1.91E+14 | 1.70E+14 | 1.71E+14 | 1.63E+14 | 1.64E+14 | 1.64E+14 | 1.70E+14 | 1.65E+14 | 1.69E+14 | 1.73E+14 | | 复合肥 | 4.55E+14 | 3.66E+14 | 3.71E+14 | 3.70E+14 | 3.71E+14 | 3.71E+14 | 3.86E+14 | 3.80E+14 | 3.88E+14 | 3.87E+14 | | 农药 | 2.86E+13 | 2.64E+13 | 2.48E+13 | 2.43E+13 | 2.42E+13 | 2.40E+13 | 2.42E+13 | 2.30E+13 | 2.39E+13 | 2.37E+13 | | 农膜 | 3.03E+12 | 3.07E+12 | 3.08E+12 | 2.98E+12 | 2.98E+12 | 3.01E+12 | 3.26E+12 | 3.36E+12 | 3.45E+12 | 3.45E+12 | | 柴油 | 7.33E+13 | 7.25E+13 | 7.07E+13 | 7.08E+13 | 7.13E+13 | 7.43E+13 | 7.36E+13 | 7.45E+13 | 7.70E+13 | 8.02E+13 | | 机械 | 4.92E+14 | 5.05E+14 | 5.21E+14 | 5.68E+14 | 5.68E+14 | 6.70E+14 | 6.71E+14 | 6.39E+14 | 9.00E+14 | 9.33E+14 | | 电力 | 1.21E+14 | 1.27E+14 | 1.16E+14 | 8.53E+14 | 8.25E+14 | 6.53E+14 | 7.69E+14 | 7.05E+14 | 6.35E+14 | 6.51E+14 | | 种子 | 1.09E+15 | 1.20E+15 | 1.18E+15 | 1.82E+15 | 3.17E+15 | 3.22E+15 | 4.04E+15 | 4.60E+15 | 5.30E+15 | 5.93E+15 | | 饲料 | 9.29E+15 | 9.45E+15 | 7.28E+15 | 6.83E+15 | 8.89E+15 | 8.65E+15 | 9.08E+15 | 9.00E+15 | 7.44E+15 | 8.36E+15 | | 人力 | 4.31E+15 | 4.17E+15 | 4.02E+15 | 4.00E+15 | 4.07E+15 | 3.98E+15 | 3.92E+15 | 3.30E+15 | 3.39E+15 | 3.28E+15 | | 服务 | 1.69E+15 | 1.64E+15 | 1.50E+15 | 1.62E+15 | 1.74E+15 | 1.74E+15 | 1.55E+15 | 1.59E+15 | 1.73E+15 | 1.91E+15 | | 购买能值合计 | 2.21E+16 | 2.13E+16 | 1.89E+16 | 1.99E+16 | 2.35E+16 | 2.25E+16 | 2.43E+16 | 2.41E+16 | 2.37E+16 | 2.54E+16 | | 能值投入合计 | 3.14E+16 | 3.02E+16 | 2.68E+16 | 2.92E+16 | 3.12E+16 | 2.98E+16 | 3.12E+16 | 3.07E+16 | 3.09E+16 | 3.33E+16 | | 系统反馈能值 | 2.75E+15 | 2.80E+15 | 2.71E+15 | 2.65E+15 | 2.72E+15 | 2.68E+15 | 2.66E+15 | 2.57E+15 | 2.54E+15 | 2.15E+15 | | 饲料粮 | 1.60E+15 | 1.55E+15 | 1.56E+15 | 1.46E+15 | 1.50E+15 | 1.47E+15 | 1.45E+15 | 1.40E+15 | 1.32E+15 | 1.09E+15 | | 秸秆作饲料 | 1.97E+14 | 2.70E+14 | 2.47E+14 | 2.58E+14 | 2.84E+14 | 2.74E+14 | 2.76E+14 | 2.70E+14 | 3.47E+14 | 2.44E+14 | | 农田对畜禽的作用 | 1.80E+15 | 1.82E+15 | 1.81E+15 | 1.71E+15 | 1.79E+15 | 1.75E+15 | 1.73E+15 | 1.67E+15 | 1.66E+15 | 1.33E+15 | | 畜力 | 1.71E+14 | 1.50E+14 | 1.14E+14 | 1.41E+14 | 1.37E+14 | 1.32E+14 | 1.30E+14 | 1.28E+14 | 1.37E+14 | 1.14E+14 | | 畜禽粪尿还田 | 5.10E+14 | 5.54E+14 | 5.19E+14 | 5.27E+14 | 5.31E+14 | 5.35E+14 | 5.34E+14 | 5.03E+14 | 4.69E+14 | 4.53E+14 | | 畜禽对农田的作用 | 6.81E+14 | 7.04E+14 | 6.33E+14 | 6.68E+14 | 6.69E+14 | 6.67E+14 | 6.64E+14 | 6.31E+14 | 6.06E+14 | 5.67E+14 |
|
Table 6. Analysis of input emergy flow of farmland-livestock production system in Dehua county from 2007 to 2016 (sej·hm-2·a-1)
| 项目 | 2007年 | 2008年 | 2009年 | 2010年 | 2011年 | 2012年 | 2013年 | 2014年 | 2015年 | 2016年 |
|---|
| 稻谷 | 4.24E+15 | 4.00E+15 | 4.10E+15 | 3.70E+15 | 3.87E+15 | 3.76E+15 | 3.67E+15 | 3.44E+15 | 3.14E+15 | 2.37E+15 | | 甘薯 | 1.94E+14 | 2.10E+14 | 1.93E+14 | 2.18E+14 | 2.11E+14 | 2.11E+14 | 2.16E+14 | 2.33E+14 | 2.38E+14 | 2.40E+14 | | 马铃薯 | 1.87E+14 | 2.17E+14 | 2.38E+14 | 2.32E+14 | 2.35E+14 | 2.38E+14 | 2.48E+14 | 2.58E+14 | 2.77E+14 | 2.79E+14 | | 茶叶 | 9.08E+13 | 1.02E+14 | 1.04E+14 | 1.06E+14 | 1.19E+14 | 1.22E+14 | 1.28E+14 | 1.28E+14 | 1.35E+14 | 1.53E+14 | | 水果 | 5.90E+15 | 6.03E+15 | 5.78E+15 | 5.84E+15 | 6.01E+15 | 6.11E+15 | 6.39E+15 | 6.44E+15 | 6.68E+15 | 7.03E+15 | | 蔬菜 | 4.93E+14 | 5.01E+14 | 4.46E+14 | 4.53E+14 | 4.54E+14 | 4.65E+14 | 4.75E+14 | 4.76E+14 | 4.97E+14 | 5.06E+14 | | 瓜果 | 2.89E+13 | 2.82E+13 | 4.28E+13 | 8.31E+13 | 8.94E+13 | 6.22E+13 | 6.36E+13 | 6.56E+13 | 6.70E+13 | 6.91E+13 | | 其他 | 4.25E+13 | 3.80E+13 | 3.48E+13 | 3.89E+13 | 3.94E+13 | 4.69E+13 | 5.62E+13 | 5.99E+13 | 6.25E+13 | 5.90E+13 | | 农田系统产出 | 1.12E+16 | 1.11E+16 | 1.09E+16 | 1.07E+16 | 1.10E+16 | 1.10E+16 | 1.12E+16 | 1.11E+16 | 1.11E+16 | 1.07E+16 | | 猪肉 | 3.70E+16 | 3.79E+16 | 3.64E+16 | 3.67E+16 | 3.72E+16 | 3.78E+16 | 3.76E+16 | 3.52E+16 | 2.24E+16 | 2.04E+16 | | 牛肉 | 1.35E+15 | 1.11E+15 | 1.21E+15 | 1.22E+15 | 1.29E+15 | 1.33E+15 | 1.46E+15 | 1.50E+15 | 1.68E+15 | 1.77E+15 | | 羊肉 | 9.25E+14 | 8.07E+14 | 7.71E+14 | 8.19E+14 | 8.19E+14 | 8.53E+14 | 9.59E+14 | 9.90E+14 | 1.08E+15 | 1.11E+15 | | 禽肉 | 1.32E+15 | 1.43E+15 | 1.41E+15 | 1.46E+15 | 1.46E+15 | 1.40E+15 | 1.20E+15 | 8.99E+14 | 8.79E+14 | 1.00E+15 | | 兔肉 | 1.27E+15 | 1.02E+15 | 9.29E+14 | 9.39E+14 | 9.37E+14 | 9.67E+14 | 1.01E+15 | 1.04E+15 | 1.11E+15 | 1.15E+15 | | 禽蛋 | 2.44E+15 | 2.42E+15 | 2.05E+15 | 2.08E+15 | 2.14E+15 | 2.21E+15 | 2.12E+15 | 2.01E+15 | 2.10E+15 | 2.14E+15 | | 蜂蜜 | 7.21E+13 | 1.02E+14 | 6.51E+13 | 7.88E+13 | 1.01E+14 | 1.01E+14 | 1.02E+14 | 1.13E+14 | 1.21E+14 | 1.19E+14 | | 畜禽系统产出 | 4.44E+16 | 4.48E+16 | 4.28E+16 | 4.33E+16 | 4.40E+16 | 4.46E+16 | 4.45E+16 | 4.18E+16 | 2.94E+16 | 2.77E+16 | | 能值产出合计 | 5.56E+16 | 5.60E+16 | 5.37E+16 | 5.40E+16 | 5.50E+16 | 5.56E+16 | 5.57E+16 | 5.29E+16 | 4.05E+16 | 3.84E+16 | | 污染能值产出 | 4.23E+15 | 3.67E+15 | 3.68E+15 | 3.67E+15 | 3.71E+15 | 3.27E+15 | 3.75E+15 | 3.65E+15 | 3.35E+15 | 3.30E+15 | | 系统净能值产出 | 5.13E+16 | 5.23E+16 | 5.00E+16 | 5.03E+16 | 5.13E+16 | 5.24E+16 | 5.20E+16 | 4.92E+16 | 3.71E+16 | 3.51E+16 |
|
Table 7. Analysis of output emergy flow of farmland-livestock production system in Dehua county from 2007 to 2016 (sej·hm-2·a-1)
| 地区 | 能值密度/(1012 sej·m-2) | 人均能值用量/1016 sej | 能值投资率 | 净能值产出率 | 环境负载率 | 可持续发展指数 |
|---|
| 德化县(2016年) | 3.33 | 1.72 | 3.22 | 1.38 | 3.32 | 0.42 | | 蒙阴县(2010年) | 0.82 | 0.24 | 11.68* | 2.58* | 11.87* | 0.22 | | 恭城县(2009年) | 1.33 | 1.13 | 1.21* | 0.94 | 1.27 | 0.74 | | 盐城市(2010年) | 0.68 | 0.14 | 4.78 | 11.12 | 4.92 | 0.97 | | 榆林市(2008年) | 0.07 | 0.97 | 0.78 | 2.28 | 0.83 | 2.76 | | 唐山市(2012年) | — | 0.42 | 35.50* | 4.14 | 21.48 | 0.19 | | 福建省(2004年) | 0.51 | 0.29 | 1.73 | 1.58 | 1.89 | 0.84* | | 湖南省(2012年) | 1.15 | 0.34 | 3.47 | 1.50 | 3.56 | 0.42 | | 甘肃省(2010年) | 0.14 | — | 2.30 | 0.92 | 2.52 | 0.34 | | 中国(2000年) | 0.54 | — | 1.11 | 2.08 | 2.72 | 0.77 | | 日本(2005年) | 6.47 | — | 11.3 | 1.09* | 13.8 | 0.08* | | 坎帕尼亚(2010年) | 0.74 | — | 6.08 | 1.16 | 7.39 | 0.16 |
|
Table 8. Emergy index of farmland-livestock production system in Dehua county in 2016 compared with other regions