
Xu Hanzong, Ge Honghao, Wang Jiefeng, Zhang Qunli, Yao Jianhua, Volodymyr S. Kovalenko. Effects of Process Parameters upon Chromium Element Distribution in Laser-Cladded 316L Stainless Steel[J]. Chinese Journal of Lasers, 2020, 47(12): 1202004
- Chinese Journal of Lasers
- Vol. 47, Issue 12, 1202004 (2020)
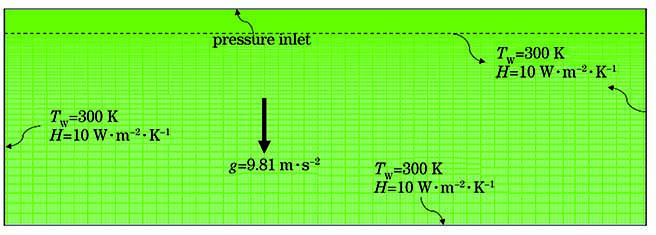
Fig. 1. Boundary condition and grid of laser cladding
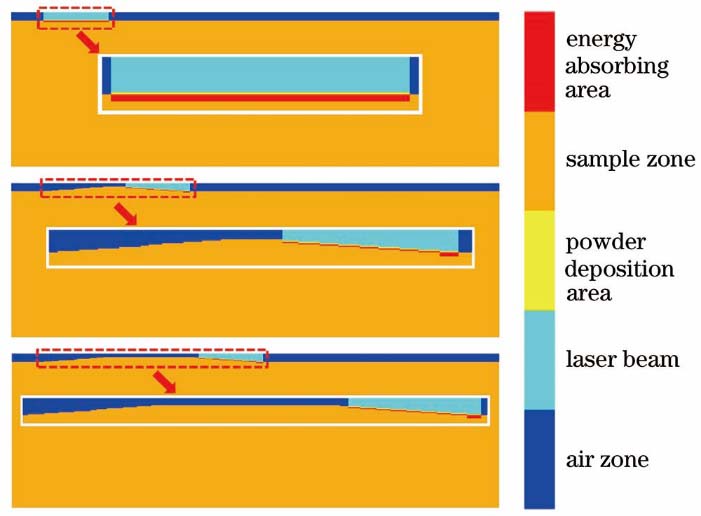
Fig. 2. Computational domain evolution model
Fig. 3. Temperature distribution cloud diagram at different time. (a) t=0.1 s; (b) t=0.2 s; (c) t=0.3 s; (d) t=0.4 s; (e) t=1.2 s; (f) t=2.0 s
Fig. 4. Volume fraction of solid phase and flow field at different time. (a) t=0.4 s; (b) t=1.2 s; (c) t=2.0 s
Fig. 5. Chromium concentration distribution at different time. (a) t=0.4 s; (b) t=1.2 s; (c) t=2.0 s
Fig. 6. Comparison between experiment and simulation. (a) Magnified image of area containing selected points in x direction; (b) metallographic image of cladding layer; (c) magnified image of area containing selected points in y direction; (d) simulation of chromium element distribution
Fig. 7. Comparison between experimental and simulation concentration in y direction
Fig. 8. Comparison between experimental and simulation concentration in x direction
Fig. 9. Orthogonal simulation results of average concentration of chromium in laser cladding layer
Fig. 10. Chromium element distribution cloud diagram
Fig. 11. Comparison of chromium element uniformity at different process parameters
Fig. 12. Simulation results at 1.2 s. (a) Temperature field; (b) volume fraction of solid phase and flow field; (c) chromium element distribution and flow field
Fig. 13. Flow diagram of molten pool at 1.2 s
| |||||||||||||||||||||||||||||||
Table 1. Chemical composition of 45 steel and 316L stainless steel
|
Table 2. Material property parameters used in calculation
| |||||||||||||||||||||||
Table 3. Factor level design table
|
Table 4. Orthogonal simulation results
| |||||||||||||||||||||||||||
Table 5. Range analysis

Set citation alerts for the article
Please enter your email address
© Copyright 2018-2021 | Chinese Laser Press. All Rights Reserved 沪ICP备15018463号-20