
Yi Dong, Weilin Xie, Yuxiang Feng, Yinxia Meng, Jiang Yang, Yan Ren. Laser Linear Sweep Frequency Technique Based on Delay Self-Heterodyne Optical Phase Locking and Its Application[J]. Acta Optica Sinica, 2021, 41(13): 1306003
- Acta Optica Sinica
- Vol. 41, Issue 13, 1306003 (2021)
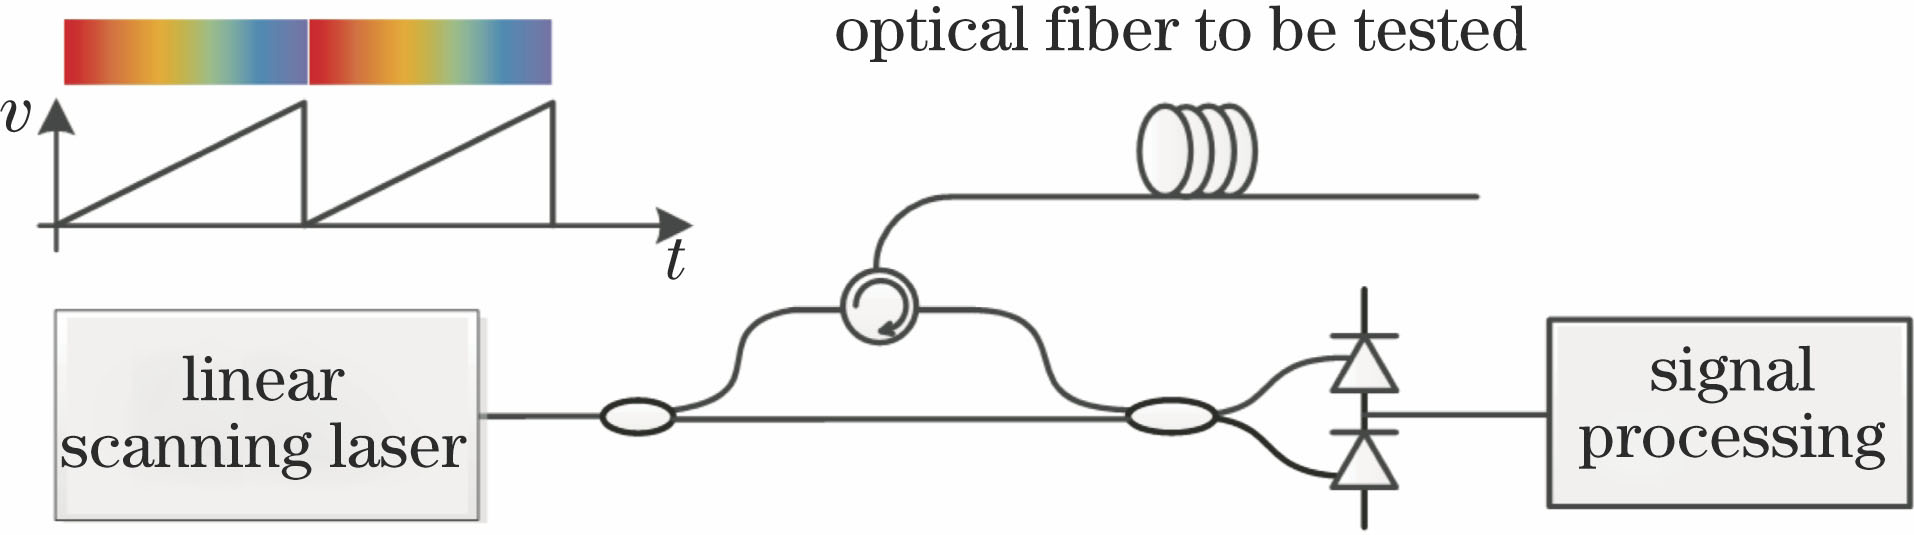
Fig. 1. Schematic diagram of OFDR
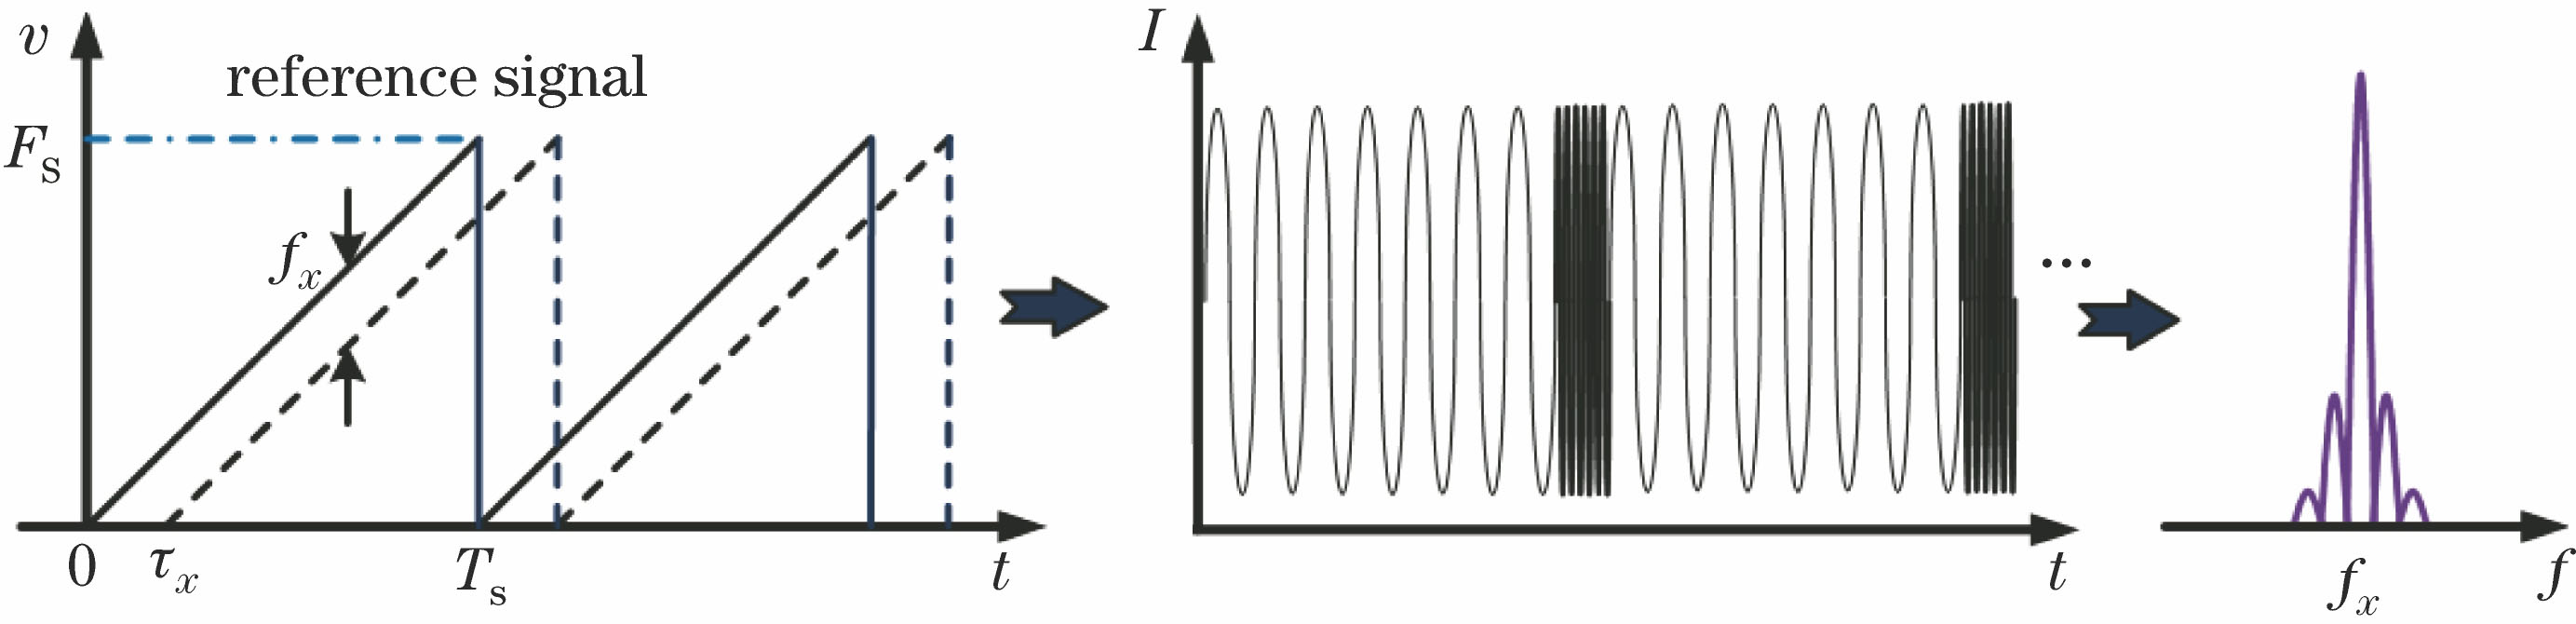
Fig. 2. Relationship between scan range and spatial resolution of OFDR
Fig. 3. Effect of laser frequency scanning error on spatial resolution for different distances
Fig. 4. Relationship between scanning laser frequency and echo signal, and mapping relationship between echo delay and beat frequency of OFDR. (a) Relationship between scanning laser frequency and echo signal; (b) mapping relationship between echo delay and beat frequency of OFDR
Fig. 5. Schematic diagram of sweep laser generation using optical phase locked control
Fig. 6. Typical results of phase locked control laser scanning. (a) Instantaneous frequency of delay heterodyne beat frequency signal; (b) spectrum of beat frequency signal before and after phase locking; (c) laser instantaneous frequency and frequency error
Fig. 7. System diagram of OFDR controlled by optical phase locking
Fig. 8. Fiber link loss of OFDR controlled by optical phase locking
Fig. 9. Measurement accuracy of optical fiber loss at different distances. (a) 10 km; (b) 100 km
Fig. 10. Optical fiber distributed strain sensing system
Fig. 11. Weighted average signal. (a) Power spectrum; (b) phase spectrum
Fig. 12. Color temperature diagram of strain varying with time and distance, and curve of strain varying with time at specific position. (a) Color temperature diagram of strain varying with time and distance; (b) curve of strain varying with time at specific position


Set citation alerts for the article
Please enter your email address

© Copyright 2018-2021 | Chinese Laser Press. All Rights Reserved 沪ICP备15018463号-20