• Chinese Journal of Lasers
  • Vol. 49, Issue 20, 2007105 (2022)
Meijie Qi1, Lixin Liu1、2、*, Yanru Li1, Yujie Liu1, Zhoufeng Zhang2, and Junle Qu3
Author Affiliations
  • 1School of Optoelectronic Engineering, Xidian University, Xi’an 710071, Shaanxi, China
  • 2Key Laboratory of Spectral Imaging Technology, Xi’an Institute of Optics and Precision Mechanics, Chinese Academy of Sciences, Xi’an 710119, Shaanxi, China
  • 3Key Laboratory of Optoelectronic Devices and Systems of Ministry of Education and Guangdong Province, College of Physics and Optoelectronic Engineering, Shenzhen University, Shenzhen 518060, Guangdong, China
  • show less
    DOI: 10.3788/CJL202249.2007105 Cite this Article Set citation alerts
    Meijie Qi, Lixin Liu, Yanru Li, Yujie Liu, Zhoufeng Zhang, Junle Qu. Design and Experiment of Push-Broom Hyperspectral Microscopic Imaging System[J]. Chinese Journal of Lasers, 2022, 49(20): 2007105 Copy Citation Text show less
    Schematic of push-broom HMI system
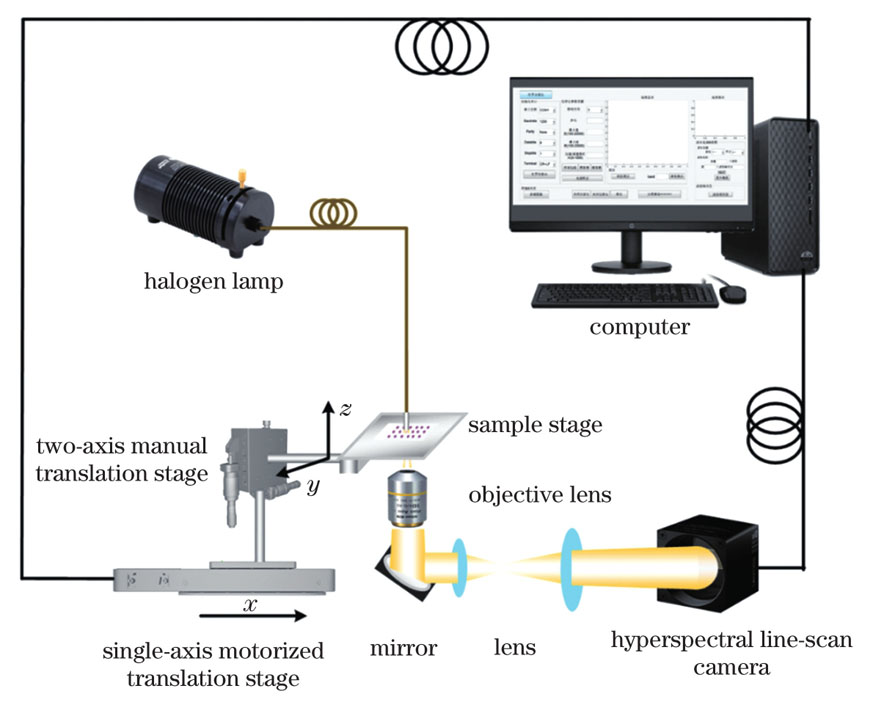
    Fig. 1. Schematic of push-broom HMI system
    Schematics of sample scanning in HMI system. (a)-(d) Start-up phase; (e) steady-state phase; (f)-(h) shutdown phase; (i) scanning result
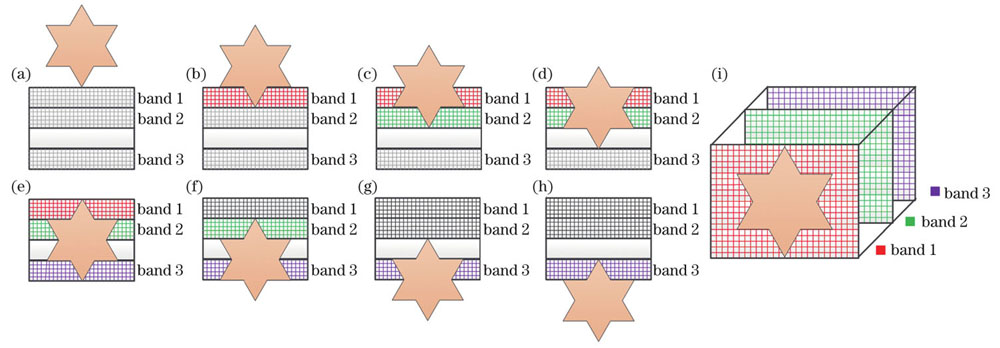
    Fig. 2. Schematics of sample scanning in HMI system. (a)-(d) Start-up phase; (e) steady-state phase; (f)-(h) shutdown phase; (i) scanning result
    Single band scanning images of resolution test panel. (a) When wavelength is 465.5 nm; (b) when wavelength is 905.1 nm
    Fig. 3. Single band scanning images of resolution test panel. (a) When wavelength is 465.5 nm; (b) when wavelength is 905.1 nm
    Interface of HMI data acquisition software
    Fig. 4. Interface of HMI data acquisition software
    Interface of HMI data analysis software
    Fig. 5. Interface of HMI data analysis software
    HMI data analysis results of squamous cell carcinoma tissue. (a) Three-dimensional HMI data; (b) spectra at marked points in Fig. 6(a); (c) single band image with wavelength of 700.1 nm; (d) single band image with wavelength of 545.3 nm; (e) single band image with wavelength of 465.5 nm; (f) RGB image
    Fig. 6. HMI data analysis results of squamous cell carcinoma tissue. (a) Three-dimensional HMI data; (b) spectra at marked points in Fig. 6(a); (c) single band image with wavelength of 700.1 nm; (d) single band image with wavelength of 545.3 nm; (e) single band image with wavelength of 465.5 nm; (f) RGB image
    Classification modelAccuracyKAPPA value
    ELM95.8%0.937
    SVM94.2%0.913
    DT88.9%0.833
    RF96.4%0.947
    Table 1. Staging results of squamous cell carcinoma
    Meijie Qi, Lixin Liu, Yanru Li, Yujie Liu, Zhoufeng Zhang, Junle Qu. Design and Experiment of Push-Broom Hyperspectral Microscopic Imaging System[J]. Chinese Journal of Lasers, 2022, 49(20): 2007105
    Download Citation