• Chinese Optics Letters
  • Vol. 17, Issue 8, 082301 (2019)
Ishwor Koirala1, Chul-Soon Park1, Sang-Shin Lee1、*, and Duk-Yong Choi2、3
Author Affiliations
  • 1Department of Electronic Engineering, Kwangwoon University, Seoul 01897, South Korea
  • 2Laser Physics Centre, Research School of Physics and Engineering, Australian National University, Canberra ACT 0200, Australia
  • 3College of Information Science and Technology, Jinan University, Guangzhou 510632, China
  • show less
    DOI: 10.3788/COL201917.082301 Cite this Article Set citation alerts
    Ishwor Koirala, Chul-Soon Park, Sang-Shin Lee, Duk-Yong Choi. Angle tolerant transmissive color filters exploiting metasurface incorporating hydrogenated amorphous silicon nanopillars[J]. Chinese Optics Letters, 2019, 17(8): 082301 Copy Citation Text show less
    (a) Schematic of the proposed color filters incorporating a-Si:H NPs. Incident white light is filtered into three primary subtractive colors of CMY. (b) Top view and (c) tilt view of SEM images for the three primary subtractive color filters for CMY with diameters of D=70, 100, and 120 nm, respectively. For the magenta filter, inset in (b) on top right of the SEM image includes the FIB cross-section image depicting the height of the a-Si:H NP. Inset in (c) for the tilt view shows the captured colored images.
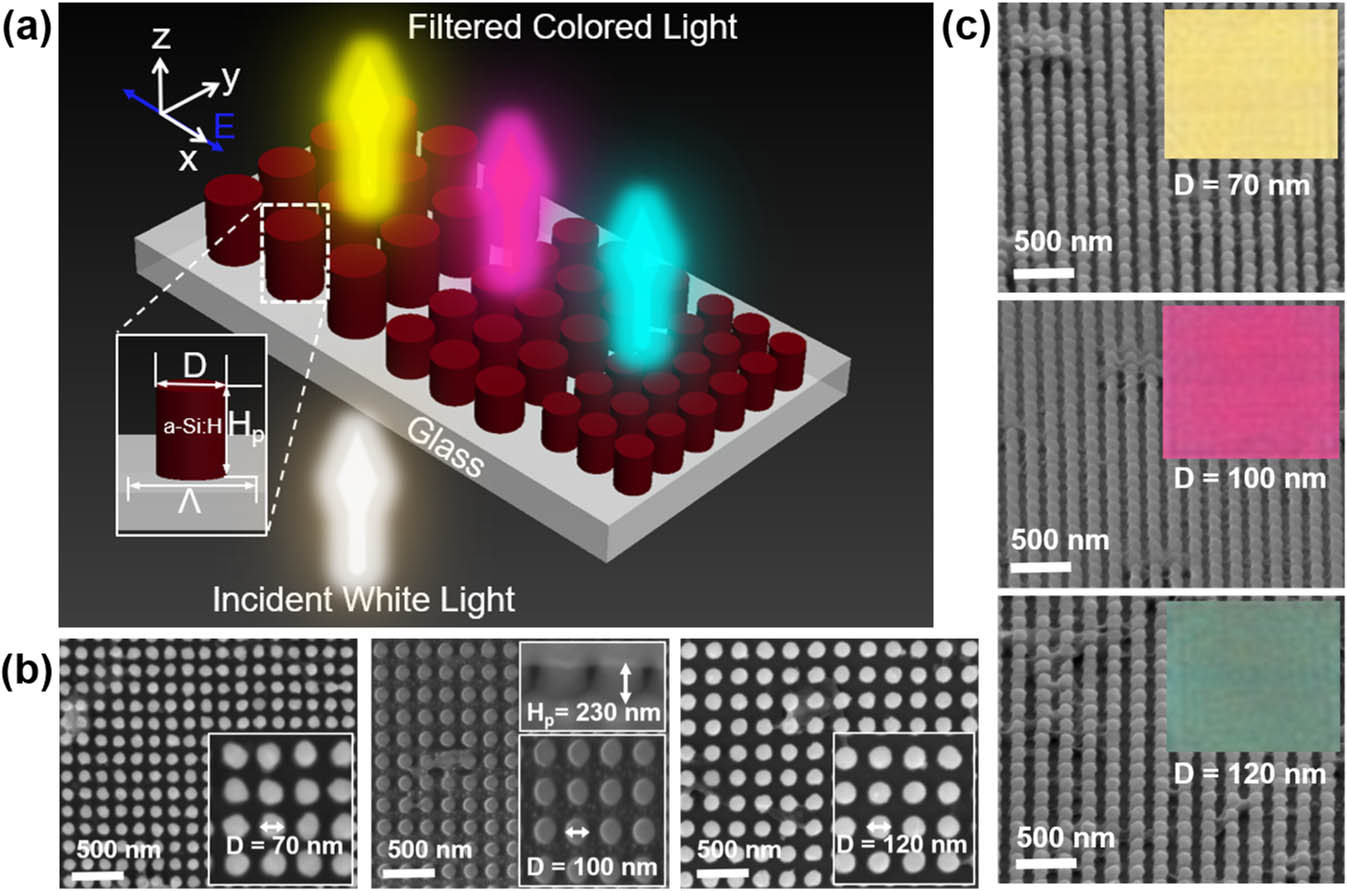
    Fig. 1. (a) Schematic of the proposed color filters incorporating a-Si:H NPs. Incident white light is filtered into three primary subtractive colors of CMY. (b) Top view and (c) tilt view of SEM images for the three primary subtractive color filters for CMY with diameters of D=70, 100, and 120 nm, respectively. For the magenta filter, inset in (b) on top right of the SEM image includes the FIB cross-section image depicting the height of the a-Si:H NP. Inset in (c) for the tilt view shows the captured colored images.
    (a) Measured and calculated transmission spectra for the subtractive color filters with diameters of D=70, 100, and 120 nm. (b) Color responses corresponding to the transmission spectra in (a) mapped in the CIE 1931 chromaticity diagram.
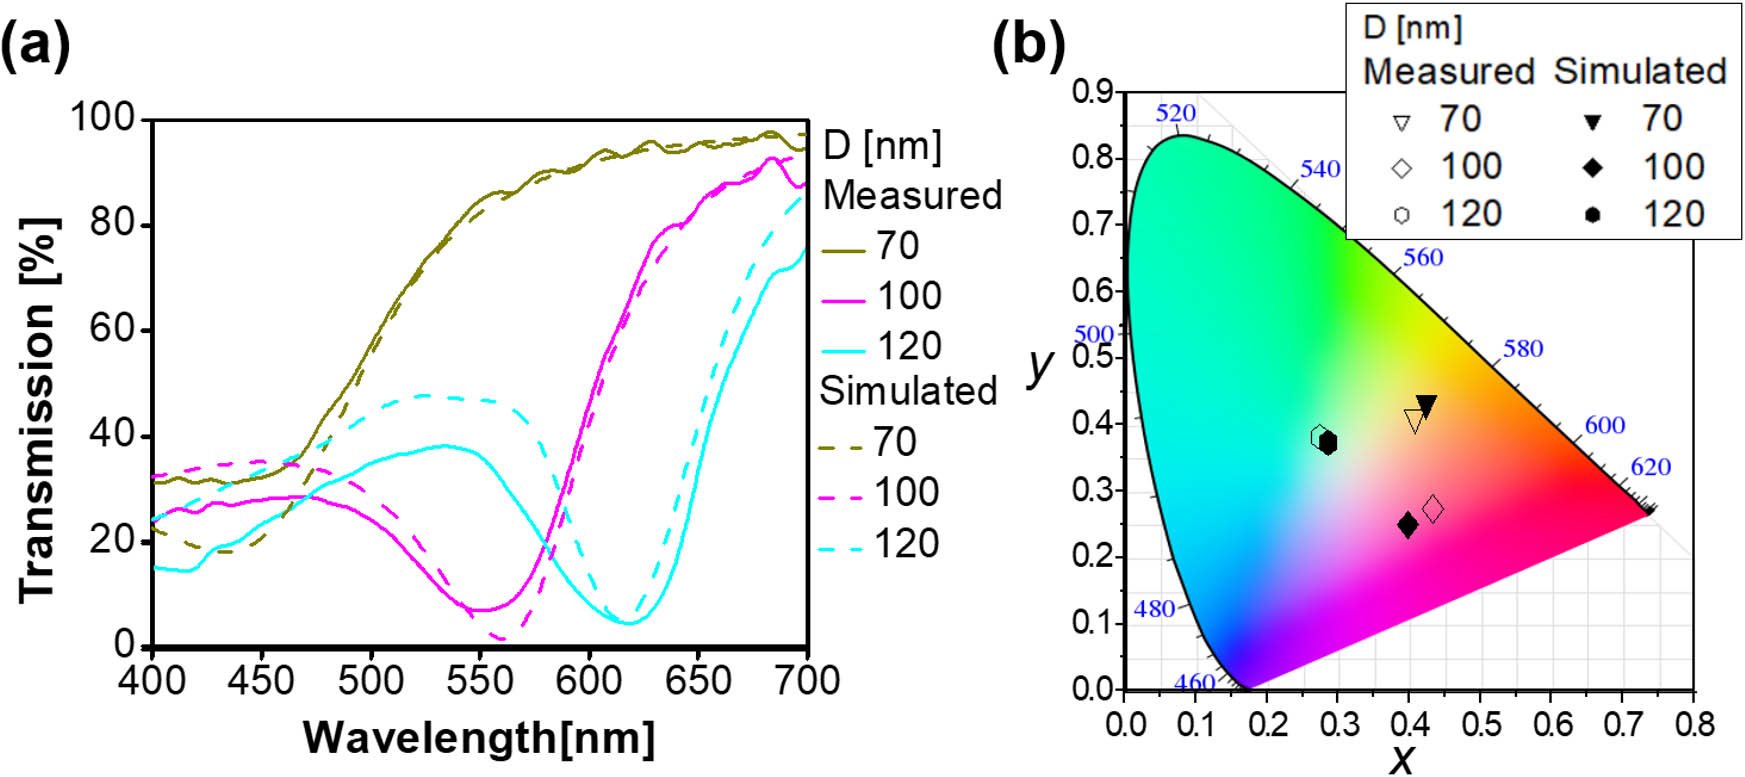
    Fig. 2. (a) Measured and calculated transmission spectra for the subtractive color filters with diameters of D=70, 100, and 120 nm. (b) Color responses corresponding to the transmission spectra in (a) mapped in the CIE 1931 chromaticity diagram.
    (a) (i) Simulated and (ii) measured transmission spectra for the color filter when the NP diameter is varied from 60 to 130 nm in increments of 10 nm. (b) Color responses corresponding to the transmission spectra in (a) are mapped in the CIE 1931 chromaticity diagram. Insets in (a)(ii) show the captured vivid color images.
    Fig. 3. (a) (i) Simulated and (ii) measured transmission spectra for the color filter when the NP diameter is varied from 60 to 130 nm in increments of 10 nm. (b) Color responses corresponding to the transmission spectra in (a) are mapped in the CIE 1931 chromaticity diagram. Insets in (a)(ii) show the captured vivid color images.
    (a) Simulated transmission (T), reflection (R), and absorption (A) spectra, denoted by the arrow, for a typical filter with D=100 nm. (b) Calculated cross-sections pertaining to the peak absorption (denoted by the arrow), scattering, and extinction, where (c) E-field and (d) H-field profiles are superimposed on the vector plot for the MD, and (e) E-field and (f) H-field profiles are superimposed on the vector plot for the ED at the resonance wavelength of 565 nm for the filter with D=100 nm.
    Fig. 4. (a) Simulated transmission (T), reflection (R), and absorption (A) spectra, denoted by the arrow, for a typical filter with D=100nm. (b) Calculated cross-sections pertaining to the peak absorption (denoted by the arrow), scattering, and extinction, where (c) E-field and (d) H-field profiles are superimposed on the vector plot for the MD, and (e) E-field and (f) H-field profiles are superimposed on the vector plot for the ED at the resonance wavelength of 565 nm for the filter with D=100nm.
    Contour plot of the transmission spectra in terms of the varied angles of incidence: (a), (b) ‘simulated’ and (c), (d) ‘measured’ cases for the TE and TM polarizations for a filter with D=100 nm.
    Fig. 5. Contour plot of the transmission spectra in terms of the varied angles of incidence: (a), (b) ‘simulated’ and (c), (d) ‘measured’ cases for the TE and TM polarizations for a filter with D=100nm.
    Ishwor Koirala, Chul-Soon Park, Sang-Shin Lee, Duk-Yong Choi. Angle tolerant transmissive color filters exploiting metasurface incorporating hydrogenated amorphous silicon nanopillars[J]. Chinese Optics Letters, 2019, 17(8): 082301
    Download Citation