
Weikang Tang, Yubin Shao, Hua Long, Qingzhi Du, Yi Peng, Liang Chen. Syllable Matching Algorithm with Spectral Peak Point Feature for Chinese Speech[J]. Laser & Optoelectronics Progress, 2022, 59(7): 0707001
- Laser & Optoelectronics Progress
- Vol. 59, Issue 7, 0707001 (2022)
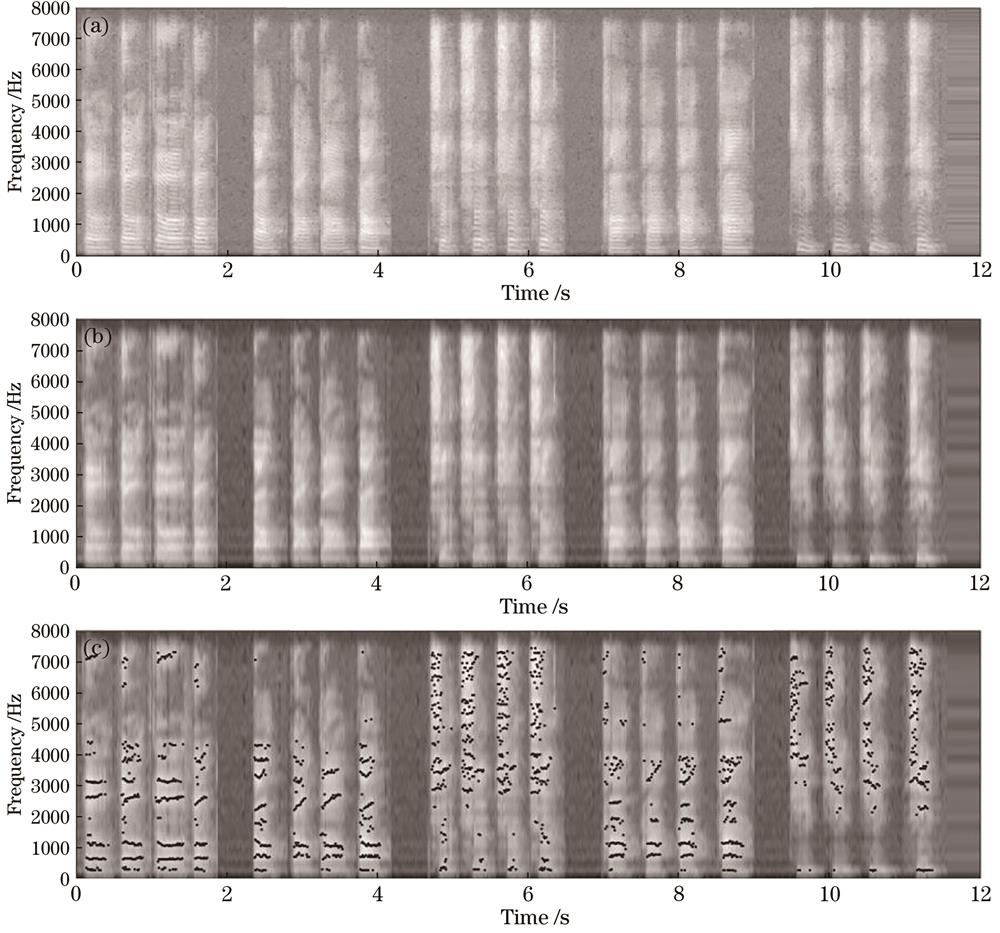
Fig. 1. Speech spectrograms and energy peak point distribution of Chinese phonetic syllables. (a) Original speech spectrogram; (b) speech envelope spectrogram; (c) energy peak point distribution
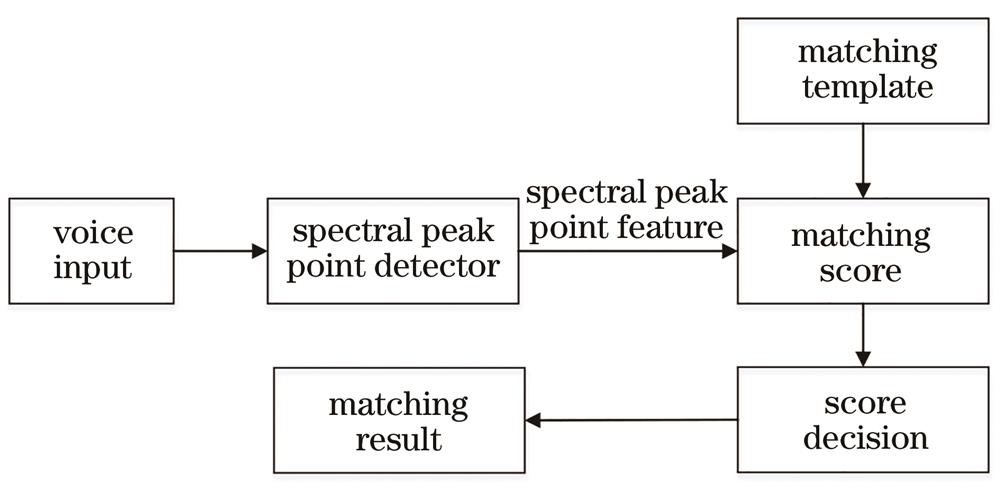
Fig. 2. Syllable matching algorithm steps
Fig. 3. Extraction of spectral peak point feature
Fig. 4. Gray-scale spectrogram of speech signal
Fig. 5. Envelope spectrogram of speech signal
Fig. 6. Energy point after thresholding
Fig. 7. Envelope spectrograms. (a) Envelope spectrogram of commonly used Chinese character pronunciation “de”; (b) envelope spectrogram after discarding partial information blow 300 Hz
Fig. 8. Distribution of energy maximum points using different division methods in frequency bands. (a) Frequency band is equally spaced; (b) logarithmic division of frequency bands
Fig. 9. Illustration of two maximum feature points in each signal frame
| |||||||||||||||||||||||||||||
Table 1. Matching accuracy of different frame numbers under different signal-to-noise ratios
| |||||||||||||||||||||||||||||
Table 2. Matching accuracy of different logarithmic frequency bands under different signal-to-noise ratios
|
Table 3. Matching accuracy of different algorithms for the same person's pronunciation in a noise-free environment
| ||||||||||||||||||||||||
Table 4. Matching accuracy of different algorithms for the same person's pronunciation in a noisy environment
|
Table 5. Matching accuracy of different algorithms for different people's pronunciation in a noise-free environment
| ||||||||||||||||||||||||
Table 6. Matching accuracy of different algorithms for different people's pronunciation in a noisy environment

Set citation alerts for the article
Please enter your email address
© Copyright 2018-2021 | Chinese Laser Press. All Rights Reserved 沪ICP备15018463号-20