• Photonics Research
  • Vol. 2, Issue 4, B70 (2014)
Gael Kervella1, Jeremy Maxin2, Mickael Faugeron1, Perrine Berger2, Hadrien Lanctuit2, Gregoire Pillet2, Loic Morvan2、*, Frederic van Dijk1, and and Daniel Dolfi2
Author Affiliations
  • 1III-V Lab, a Joint Laboratory of Alcatel Lucent Bell Labs, Thales Research & Technology, and CEA-LETI, Campus Polytechnique, 1, Av. A. Fresnel, 91767 Palaiseau, France
  • 2Thales Research and Technology, Campus Polytechnique, 1, Av. A. Fresnel, 91767 Palaiseau, France
  • show less
    DOI: 10.1364/PRJ.2.000B70 Cite this Article Set citation alerts
    Gael Kervella, Jeremy Maxin, Mickael Faugeron, Perrine Berger, Hadrien Lanctuit, Gregoire Pillet, Loic Morvan, Frederic van Dijk, and Daniel Dolfi. Laser sources for microwave to millimeter-wave applications [Invited][J]. Photonics Research, 2014, 2(4): B70 Copy Citation Text show less
    Output power as a function of bias current.
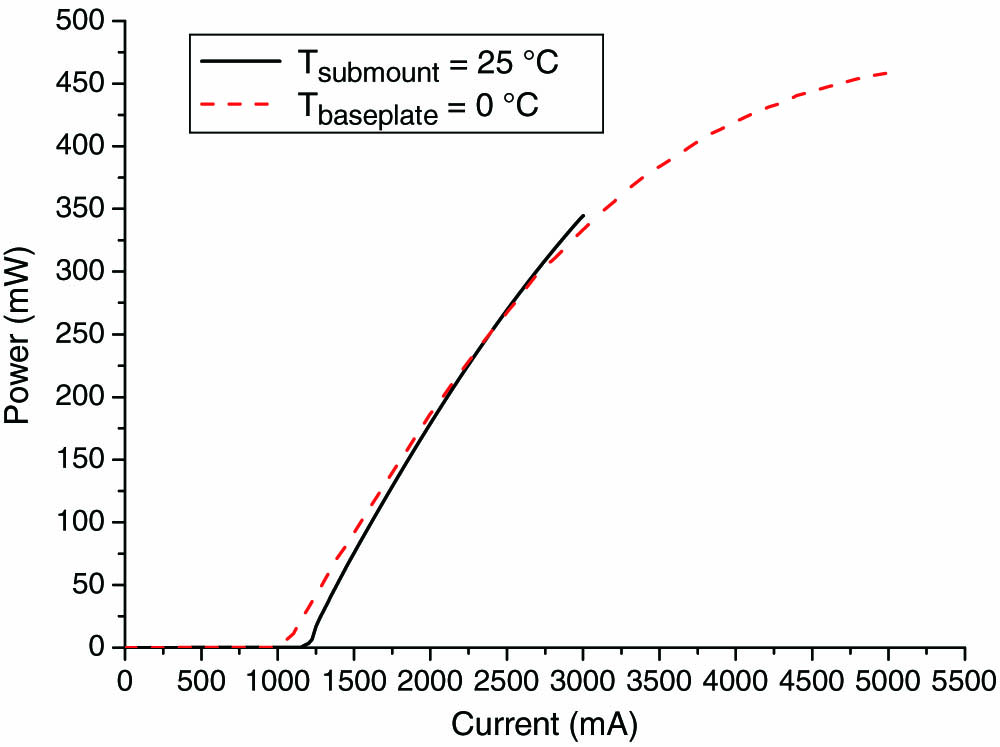
    Fig. 1. Output power as a function of bias current.
    Optical spectrum at 2 A.
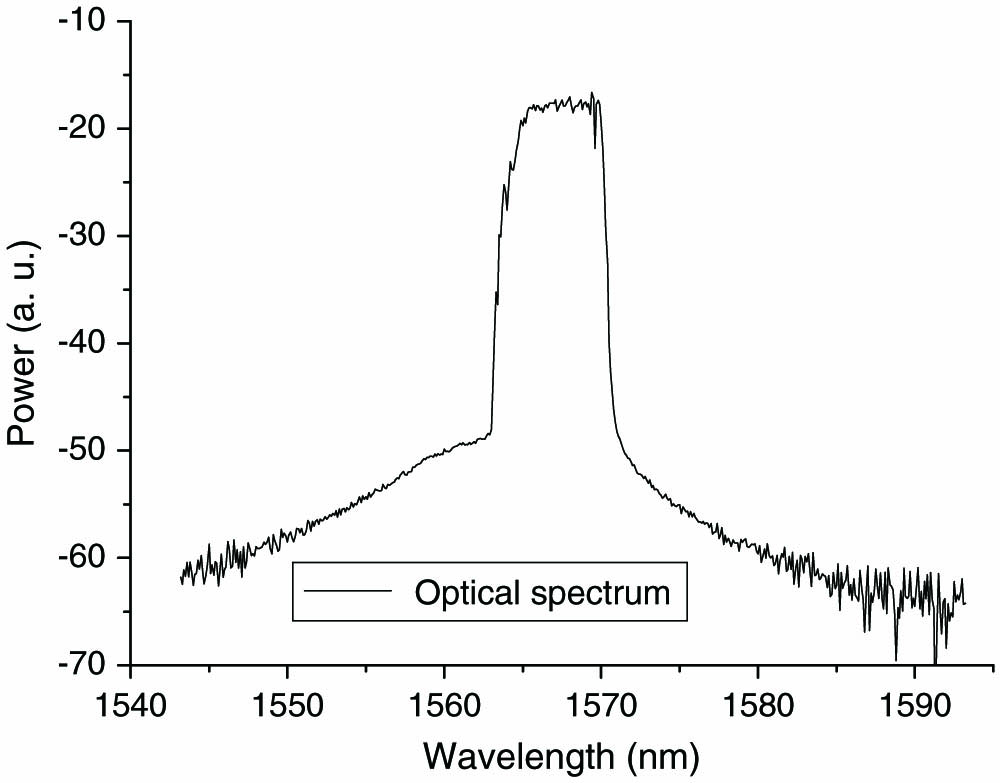
    Fig. 2. Optical spectrum at 2 A.
    RF spectrum with optical compression at 2.24 A (Iph=1.6 mA).
    Fig. 3. RF spectrum with optical compression at 2.24 A (Iph=1.6mA).
    Fundamental tone with and without optical compression.
    Fig. 4. Fundamental tone with and without optical compression.
    Sampling scope trace of detected pulse train for passive mode-locking.
    Fig. 5. Sampling scope trace of detected pulse train for passive mode-locking.
    Autocorrelation trace with optical compression at 2.14 A.
    Fig. 6. Autocorrelation trace with optical compression at 2.14 A.
    General principle.
    Fig. 7. General principle.
    View of the monolithic chip for millimeter-wave transmission.
    Fig. 8. View of the monolithic chip for millimeter-wave transmission.
    General view of the test setup.
    Fig. 9. General view of the test setup.
    Electrical and optical spectra obtained for different laser biasing conditions.
    Fig. 10. Electrical and optical spectra obtained for different laser biasing conditions.
    Wireless data transmission experiment diagram.
    Fig. 11. Wireless data transmission experiment diagram.
    Eye diagram for 200 MBit/s transmission.
    Fig. 12. Eye diagram for 200MBit/s transmission.
    Setup for precise control and stabilization of broadband arbitrary frequency sweeps by fibered self-heterodyne technique. Abbreviations are defined in the text.
    Fig. 13. Setup for precise control and stabilization of broadband arbitrary frequency sweeps by fibered self-heterodyne technique. Abbreviations are defined in the text.
    (a) Setup for the predistortion correction, using an out-of-loop optical frequency discriminator. (b) Nominal frequency sweep. (c) Predistorted control voltage. (d), (e) Error from the nominal frequency sweep: in blue for the free-running laser (with the predistorted control voltage) and in green for the optoelectronic feedback loop in which the optical frequency sweep is phase locked to a reference electronic signal.
    Fig. 14. (a) Setup for the predistortion correction, using an out-of-loop optical frequency discriminator. (b) Nominal frequency sweep. (c) Predistorted control voltage. (d), (e) Error from the nominal frequency sweep: in blue for the free-running laser (with the predistorted control voltage) and in green for the optoelectronic feedback loop in which the optical frequency sweep is phase locked to a reference electronic signal.
    Solid-state DFL source cavity principle. V1 and V2 are the voltages that allow the independent control of the two frequencies.
    Fig. 15. Solid-state DFL source cavity principle. V1 and V2 are the voltages that allow the independent control of the two frequencies.
    Phase noise of one of the optical modes (red curve) and phase noise of the beat note at 10 GHz (blue curve).
    Fig. 16. Phase noise of one of the optical modes (red curve) and phase noise of the beat note at 10 GHz (blue curve).
    Locking scheme of one of the DFL optical lines on a high-Q FRR. PDH: Pound–Drever–Hall setup. PID: proportional-integral-derivative controller.
    Fig. 17. Locking scheme of one of the DFL optical lines on a high-Q FRR. PDH: Pound–Drever–Hall setup. PID: proportional-integral-derivative controller.
    Phase noise of one of the optical modes: free running (red curve) and locked (orange curve). Phase noise of the beat note when locked (blue curve).
    Fig. 18. Phase noise of one of the optical modes: free running (red curve) and locked (orange curve). Phase noise of the beat note when locked (blue curve).
    Gael Kervella, Jeremy Maxin, Mickael Faugeron, Perrine Berger, Hadrien Lanctuit, Gregoire Pillet, Loic Morvan, Frederic van Dijk, and Daniel Dolfi. Laser sources for microwave to millimeter-wave applications [Invited][J]. Photonics Research, 2014, 2(4): B70
    Download Citation