• Advanced Photonics
  • Vol. 4, Issue 1, 014001 (2022)
Jianyu Zhang1、†, Xueqian Zhao1, Hanchen Shen1, Jacky W. Y. Lam1, Haoke Zhang2、3、4、*, and Ben Zhong Tang1、4、5、6、*
Author Affiliations
  • 1The Hong Kong University of Science and Technology, Department of Chemistry, Hong Kong Branch of Chinese National Engineering Research Center for Tissue Restoration and Reconstruction, and Guangdong-Hong Kong-Macau Joint Laboratory of Optoelectronic and Magnetic Functional Materials, Clear Water Bay, Kowloon, Hong Kong, China
  • 2Zhejiang University, MOE Key Laboratory of Macromolecular Synthesis and Functionalization, Department of Polymer Science and Engineering, Hangzhou, China
  • 3ZJU-Hangzhou Global Scientific and Technological Innovation Center, Hangzhou, China
  • 4South China University of Technology, Guangdong Provincial Key Laboratory of Luminescence from Molecular Aggregates, Guangzhou, China
  • 5The Chinese University of Hong Kong, Shenzhen Institute of Aggregate Science and Technology, School of Science and Engineering, Shenzhen, China
  • 6AIE Institute, Guangzhou Development District, Guangzhou, China
  • show less
    DOI: 10.1117/1.AP.4.1.014001 Cite this Article Set citation alerts
    Jianyu Zhang, Xueqian Zhao, Hanchen Shen, Jacky W. Y. Lam, Haoke Zhang, Ben Zhong Tang. White-light emission from organic aggregates: a review[J]. Advanced Photonics, 2022, 4(1): 014001 Copy Citation Text show less
    General scheme of single-component and multicomponent strategies to achieve white-light emission from organic aggregates. Ex., excitation; Fluo., fluorescence; Phos., phosphorescence;Em., emission; ISC, intersystem crossing.
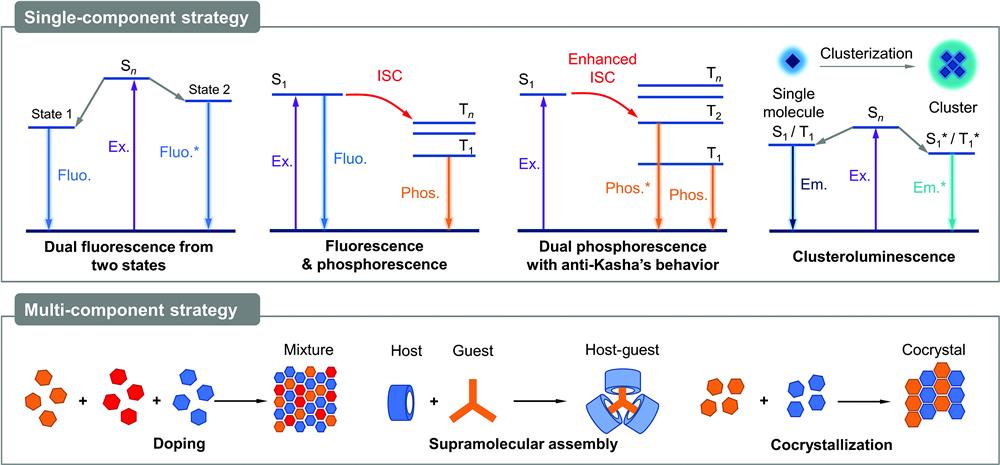
    Fig. 1. General scheme of single-component and multicomponent strategies to achieve white-light emission from organic aggregates. Ex., excitation; Fluo., fluorescence; Phos., phosphorescence;Em., emission; ISC, intersystem crossing.
    Schematic illustration of three types of dual emissions from two fluorescent states. LE, locally excited; CT, charge transfer. (a) (Upper panel) The molecular conformations and photophysical behaviors of DPAC-Tri(o1,2) in a low-viscosity and high-viscosity solution/solid state; (lower panel) PL spectra of DPAC-Tri(o1,2) in different states of polytetrahydrofuran (polyTHF); (inset) fluorescent photo of DPAC-Tri(o1,2) (concentration: 10−5 mol/L) in solidified polyTHF with an Mn of 2000 Da. The excitation wavelength is 365 nm. Figures are reproduced with permission from Ref. 39. (b) (Upper panel) Chemical structure, crystal packing, and calculated HOMO-LUMO distribution of o-CP; (lower panel) PL spectra and photo of a white LED based on o-CP. Figures are reproduced with permission from Ref. 40. (c) (Upper panel) Chemical structure, crystal packing of CPzPO; PL spectra and photo of CPzPO before and after grinding. Figures are reproduced with permission from Ref. 41.
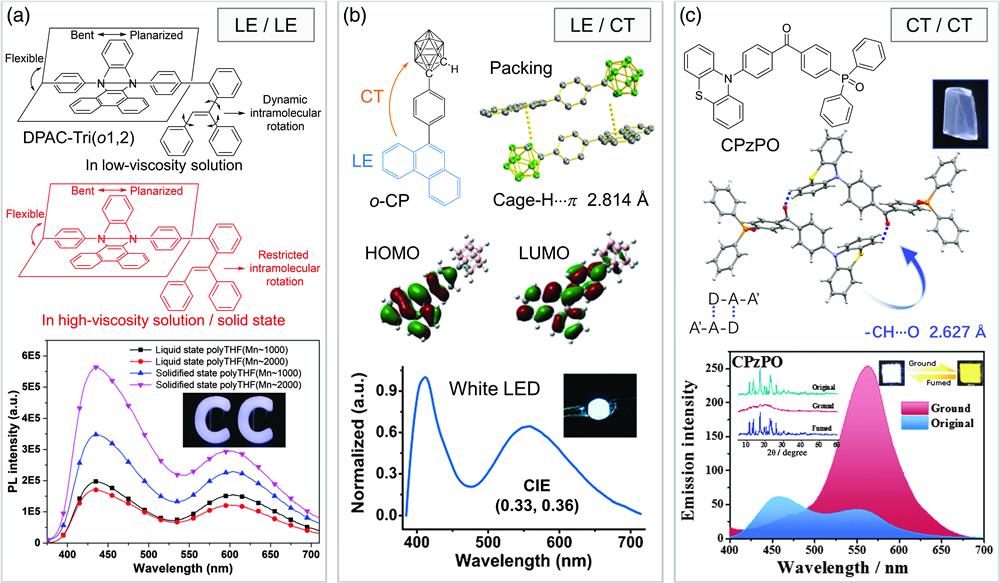
    Fig. 2. Schematic illustration of three types of dual emissions from two fluorescent states. LE, locally excited; CT, charge transfer. (a) (Upper panel) The molecular conformations and photophysical behaviors of DPAC-Tri(o1,2) in a low-viscosity and high-viscosity solution/solid state; (lower panel) PL spectra of DPAC-Tri(o1,2) in different states of polytetrahydrofuran (polyTHF); (inset) fluorescent photo of DPAC-Tri(o1,2) (concentration: 105 mol/L) in solidified polyTHF with an Mn of 2000 Da. The excitation wavelength is 365 nm. Figures are reproduced with permission from Ref. 39. (b) (Upper panel) Chemical structure, crystal packing, and calculated HOMO-LUMO distribution of o-CP; (lower panel) PL spectra and photo of a white LED based on o-CP. Figures are reproduced with permission from Ref. 40. (c) (Upper panel) Chemical structure, crystal packing of CPzPO; PL spectra and photo of CPzPO before and after grinding. Figures are reproduced with permission from Ref. 41.
    (a) PL spectrum of organic salt, TPO-Br, under room temperature; (inset) chemical structure of TPO-Br. (b) The CIE chromaticity coordinate of emission from TPO-Br film. (c) Single-crystal structure of TPO-Br and its anion–π+ interactions. (d) The theoretically calculated energy diagram and spin-orbit couplings (ξ) between singlet and triplet states of TPO-Br based on the optimized ground-state geometry using the ONIOM method. Figures are reproduced with permission from Ref. 63.
    Fig. 3. (a) PL spectrum of organic salt, TPO-Br, under room temperature; (inset) chemical structure of TPO-Br. (b) The CIE chromaticity coordinate of emission from TPO-Br film. (c) Single-crystal structure of TPO-Br and its anion–π+ interactions. (d) The theoretically calculated energy diagram and spin-orbit couplings (ξ) between singlet and triplet states of TPO-Br based on the optimized ground-state geometry using the ONIOM method. Figures are reproduced with permission from Ref. 63.
    (a) Chemical structure of ClBDBT and luminescent photos of its powder with or without irradiation of 365 nm UV lamp. (b) Experimental and calculated PL spectra of ClBDBT powder. (c) The CIE chromaticity coordinate of emission from solid ClBDBT. (d) PL decay curve of the short-wavelength emission (λem=467 nm) under different temperatures. (e) PL decay curve of the long-wavelength emission (λem=551 nm) under different temperatures. The excitation wavelength is 365 nm. (f) Adiabatic energy diagram and oscillator strength between two triplet states and ground state calculated at (TD) B3LYP/6-31(d)/GAFF level. Figures are reproduced with permission from Ref. 81.
    Fig. 4. (a) Chemical structure of ClBDBT and luminescent photos of its powder with or without irradiation of 365 nm UV lamp. (b) Experimental and calculated PL spectra of ClBDBT powder. (c) The CIE chromaticity coordinate of emission from solid ClBDBT. (d) PL decay curve of the short-wavelength emission (λem=467  nm) under different temperatures. (e) PL decay curve of the long-wavelength emission (λem=551  nm) under different temperatures. The excitation wavelength is 365 nm. (f) Adiabatic energy diagram and oscillator strength between two triplet states and ground state calculated at (TD) B3LYP/6-31(d)/GAFF level. Figures are reproduced with permission from Ref. 81.
    (a) Chemical structures of linear CO2-derived PHU and schematic diagram of intermolecular and intramolecular interactions of solid PHU. (b) PL spectra of solid PHU with different excitation wavelengths from 280 to 440 nm. (c) PL spectra of the white OLED fabricated by PHU and UV chip; (inset) PL spectra of the UV chip. (d) The CIE chromaticity coordinate of emission and luminescent photo of the white OLED. Figures are reproduced with permission from Ref. 92.
    Fig. 5. (a) Chemical structures of linear CO2-derived PHU and schematic diagram of intermolecular and intramolecular interactions of solid PHU. (b) PL spectra of solid PHU with different excitation wavelengths from 280 to 440 nm. (c) PL spectra of the white OLED fabricated by PHU and UV chip; (inset) PL spectra of the UV chip. (d) The CIE chromaticity coordinate of emission and luminescent photo of the white OLED. Figures are reproduced with permission from Ref. 92.
    (a) Chemical structures and luminescent photos of the perchalcogenated arenes, where X stands for the element of O (Arene-O), S (Arene-S), and Se (Arene-Se), respectively. (b)–(d) PL spectra of three arenes in the solid state. (e) PL spectrum and luminescent photo of the solid mixture of Arene-O, Arene-S, Arene-Se with the molar ratio of 300:1:3. Figures are reproduced with permission from Ref. 97. (f) Chemical structure and preparation of white light-emitting silk through bioconjugation with TPE-pyo (blue), MTPEP-pyo (green), and MTPABP-pyo (red) at a molar ratio of 88:6:6. (g) PL spectrum and the CIE chromaticity coordinate of the fabricated white light-emitting silk. Figures are reproduced with permission from Ref. 98.
    Fig. 6. (a) Chemical structures and luminescent photos of the perchalcogenated arenes, where X stands for the element of O (Arene-O), S (Arene-S), and Se (Arene-Se), respectively. (b)–(d) PL spectra of three arenes in the solid state. (e) PL spectrum and luminescent photo of the solid mixture of Arene-O, Arene-S, Arene-Se with the molar ratio of 300:1:3. Figures are reproduced with permission from Ref. 97. (f) Chemical structure and preparation of white light-emitting silk through bioconjugation with TPE-pyo (blue), MTPEP-pyo (green), and MTPABP-pyo (red) at a molar ratio of 88:6:6. (g) PL spectrum and the CIE chromaticity coordinate of the fabricated white light-emitting silk. Figures are reproduced with permission from Ref. 98.
    (a) Chemical structures of BPO as the matrix and IQL-nCz as the dopant. (b) PL spectra of the IQL-nCz/BPO-doped material with a molar ratio of 1:1000 under different excitation wavelengths. (c) The CIE chromaticity coordinate of the IQL-nCz/BPO-doped material under different excitation wavelength; (inset) luminescent photo taken under an excitation wavelength of 370 nm. Figures are reproduced with permission from Ref. 101. (d) Schematic mechanism of excitation and decay processes of this kind of dopant/matrix system. FL, fluorescence; ISC, intersystem crossing; RTP, room-temperature phosphorescence. Figures are reproduced with permission from Ref. 58.
    Fig. 7. (a) Chemical structures of BPO as the matrix and IQL-nCz as the dopant. (b) PL spectra of the IQL-nCz/BPO-doped material with a molar ratio of 1:1000 under different excitation wavelengths. (c) The CIE chromaticity coordinate of the IQL-nCz/BPO-doped material under different excitation wavelength; (inset) luminescent photo taken under an excitation wavelength of 370 nm. Figures are reproduced with permission from Ref. 101. (d) Schematic mechanism of excitation and decay processes of this kind of dopant/matrix system. FL, fluorescence; ISC, intersystem crossing; RTP, room-temperature phosphorescence. Figures are reproduced with permission from Ref. 58.
    (Upper panel) Chemical structure of the AIE-active luminogen of TPP and crystal structure of chiral building block based on TPP. (Lower panel) Preparation of the DPP@TPP-Cage complex, crystal structure of DPP@TPP-Cage complex with white emission, and the CIE chromaticity coordinate of emission from DPP@TPP-Cage in poly(ethylene glycol) film deposited on a UV flashlight. Figures are reproduced with permission from Ref. 111.
    Fig. 8. (Upper panel) Chemical structure of the AIE-active luminogen of TPP and crystal structure of chiral building block based on TPP. (Lower panel) Preparation of the DPP@TPP-Cage complex, crystal structure of DPP@TPP-Cage complex with white emission, and the CIE chromaticity coordinate of emission from DPP@TPP-Cage in poly(ethylene glycol) film deposited on a UV flashlight. Figures are reproduced with permission from Ref. 111.
    (a) Schematic illustration and luminescent photos of cocrystals formed by cocrystallization of PR and DITFB with molar ratios of 1:0 (P1D0), 2:1 (P2D1), and 1:1 (P1D1), respectively. (b) PL spectra of three cocrystals and their CIE chromaticity coordinates. (c) Single-crystal packing of P2D1 viewed along the ac plane. (d) Jablonski diagrams of P2D1 cocrystal with theoretically calculated energy levels and rate constants calculated from experimental data. Figures are reproduced with permission from Ref. 124.
    Fig. 9. (a) Schematic illustration and luminescent photos of cocrystals formed by cocrystallization of PR and DITFB with molar ratios of 1:0 (P1D0), 2:1 (P2D1), and 1:1 (P1D1), respectively. (b) PL spectra of three cocrystals and their CIE chromaticity coordinates. (c) Single-crystal packing of P2D1 viewed along the ac plane. (d) Jablonski diagrams of P2D1 cocrystal with theoretically calculated energy levels and rate constants calculated from experimental data. Figures are reproduced with permission from Ref. 124.
    Examples of application of organic white-light emission materials. (a) (Left) Chemical structure of 2PQ-PTZ and device photo of a single-component OLED that is realized by conformational isomerization of 2PQ-PTZ. Figures are reproduced with permission from Ref. 45. (Right) Chemical structures of TTPEPy and BTPETTD and photos of an OLED constructed from them that shows green and red colors, respectively. The white OLED was constructed from two components of TTPEPy and BTPETTD with each thickness of 10 nm. Figures are reproduced with permission from Ref. 130. (b) (Left) White fluorescent silk fabric fabricated through bioconjugation between natural silk and AIEgens of TPE-pyo, MTPEP-pyo, and MTPABP-pyo. Figures are reproduced with permission from Ref. 98. (Right) Photos of 3D-printed lampshades without and with TPO-Br taken under daylight and 365 nm UV lamp. Figures are reproduced with permission from Ref. 63. (c) Schematic illustration of 3D spiral banded spherulite doped with PDHA aggregates and its mechanism for white CPL. Figures are reproduced with permission from Ref. 131. (d) Luminescent images drawn with IQL-Ph and IQL-TPA doped BPO under (left) and after (right) irradiation of a UV lamp with 370 nm wavelength, which can be utilized for information encryption. Figures are reproduced with permission from Ref. 101.
    Fig. 10. Examples of application of organic white-light emission materials. (a) (Left) Chemical structure of 2PQ-PTZ and device photo of a single-component OLED that is realized by conformational isomerization of 2PQ-PTZ. Figures are reproduced with permission from Ref. 45. (Right) Chemical structures of TTPEPy and BTPETTD and photos of an OLED constructed from them that shows green and red colors, respectively. The white OLED was constructed from two components of TTPEPy and BTPETTD with each thickness of 10 nm. Figures are reproduced with permission from Ref. 130. (b) (Left) White fluorescent silk fabric fabricated through bioconjugation between natural silk and AIEgens of TPE-pyo, MTPEP-pyo, and MTPABP-pyo. Figures are reproduced with permission from Ref. 98. (Right) Photos of 3D-printed lampshades without and with TPO-Br taken under daylight and 365 nm UV lamp. Figures are reproduced with permission from Ref. 63. (c) Schematic illustration of 3D spiral banded spherulite doped with PDHA aggregates and its mechanism for white CPL. Figures are reproduced with permission from Ref. 131. (d) Luminescent images drawn with IQL-Ph and IQL-TPA doped BPO under (left) and after (right) irradiation of a UV lamp with 370 nm wavelength, which can be utilized for information encryption. Figures are reproduced with permission from Ref. 101.
    StrategyCompoundStateEmission max. (nm)Quantum (%)CIE coordinateRef.
    Dual fluorescenceDPAC-Tri(o1,2)Doped in polyTHF435/6106.8(0.28, 0.25)45
    o-CPCrystal410/55746.0(0.33, 0.36)50
    CPzPOCrystal/film459/56436.1(0.31, 0.32)53
    Fluorescence and phosphorescenceTPO-BrCrystal434/54936.6(0.32, 0.33)63
    Dual phosphorescenceClBDBTCrystal467/5517.2(0.33, 0.35)81
    ClusteroluminescencePHUFilm476/550(0.33, 0.38)92
    DopingArene-OCrystalline film500/5808.0(0.27,0.34)97
    42.0a
    Arene-S
    21.0a
    Arene-Se
    TPE-pyoDoped in silk482/59514.1b(0.33, 0.36)98
    MTPEP-pyo22.2b
    MTPABP-pyo6.6b
    IQL-nCz/BPOPowder460/57075.8/33.7c(0.32, 0.32)101
    Supramolecular assemblyDPP@TPP-CageAggregate or film in PEG430/535(0.36, 0.33)111
    Q[7]/G1Solid mixture487/580(0.33, 0.36)112
    Q[8]/G1
    CocrystallizationP1D1Crystal470/55016.6(0.31, 0.31)124
    Table 1. Summarized emission properties of all compounds mentioned in this review.
    Jianyu Zhang, Xueqian Zhao, Hanchen Shen, Jacky W. Y. Lam, Haoke Zhang, Ben Zhong Tang. White-light emission from organic aggregates: a review[J]. Advanced Photonics, 2022, 4(1): 014001
    Download Citation