• Spectroscopy and Spectral Analysis
  • Vol. 41, Issue 8, 2586 (2021)
Jin-ping ZOU1、*, Shuai ZHANG2、2;, Wen-tao DONG2、2;, and Hai-liang ZHANG2、2; *;
Author Affiliations
  • 11. Jiangxi Biotech Vocational College, Nanchang 330013, China
  • 22. School of Electrical and Automation Engineering, East China JiaoTong University, Nanchang 330013, China
  • show less
    DOI: 10.3964/j.issn.1000-0593(2021)08-2586-05 Cite this Article
    Jin-ping ZOU, Shuai ZHANG, Wen-tao DONG, Hai-liang ZHANG. Application of Hyperspectral Image to Detect the Content of Total Nitrogen in Fish Meat Volatile Base[J]. Spectroscopy and Spectral Analysis, 2021, 41(8): 2586 Copy Citation Text show less
    Imaging system schematic diagram of hyperspectral
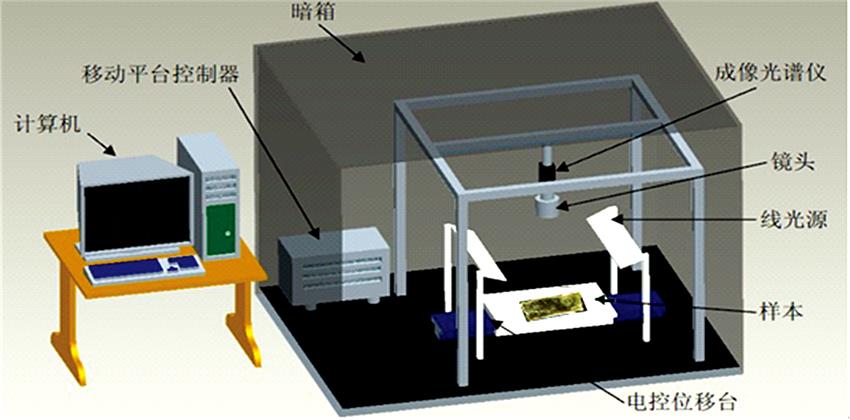
    Fig. 1. Imaging system schematic diagram of hyperspectral
    The reflectance spectra of salmon fish fillets at different TVB-N values
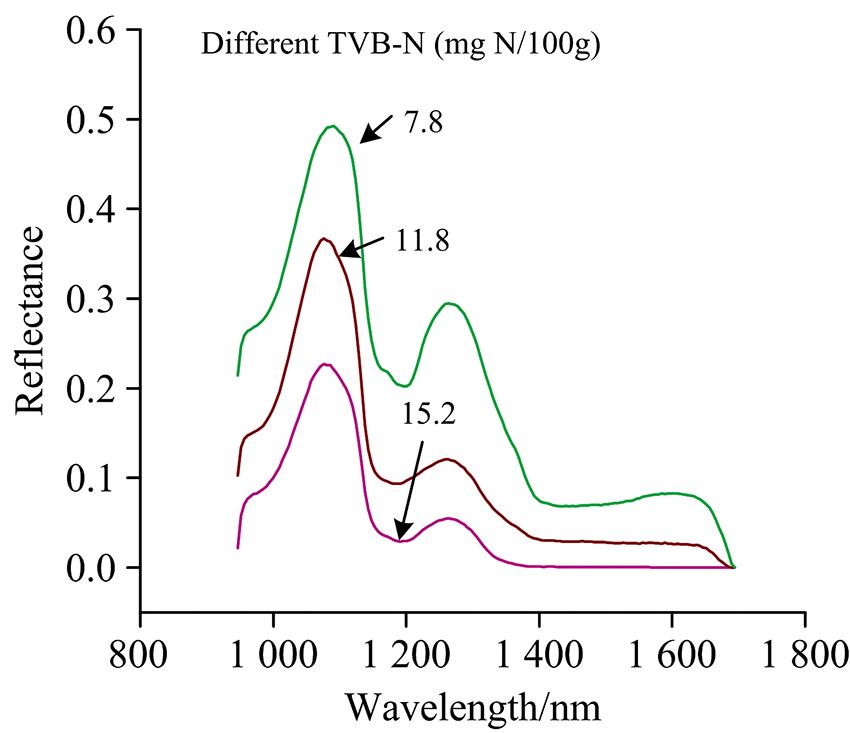
    Fig. 2. The reflectance spectra of salmon fish fillets at different TVB-N values
    Predicted and measured TVB-N values for both the PLS (a) and LS-SVM (b) models under the whole spectral wavelengths range
    Fig. 3. Predicted and measured TVB-N values for both the PLS (a) and LS-SVM (b) models under the whole spectral wavelengths range
    Position of selected effective wavelengths by SPA
    Fig. 4. Position of selected effective wavelengths by SPA
    Visualization of the predicted TVB-N content for 4 fish samples in prediction set
    Fig. 5. Visualization of the predicted TVB-N content for 4 fish samples in prediction set
    Main steps of detection of salmon fish fillets TVB-N content using HIS
    Fig. 6. Main steps of detection of salmon fish fillets TVB-N content using HIS
    TVB-NCalibrationPrediction
    Minimum7.848.01
    Maximum16.4915.98
    Mean12.4212.13
    Standard deviation5.425.28
    Table 1. Reference values of TVB-N content (mg N/100 g) measured by a traditional method
    Model
    type
    Number of
    wavelength
    LVsCalibrationPrediction
    Rc2RMSEC/%RP2RMSEP/%
    LS-SVM167/0.9192.2920.9182.312
    PLS167100.9052.7420.9072.751
    Table 2. Prediction results of LS-SVM and PLS based on full spectral parameters
    算法数量选择波长/nm
    SPA8956, 1 013, 1 152, 1 210, 1 286,
    1 301, 1 397, 1 464
    Table 3. Effective wavelengths selected by SPA
    Model
    type
    Number of
    wavelength
    LVsCalibrationPrediction
    Rc2RMSEC/%Rp2RMSEP/%
    SPA-LS-SVM8/0.9042.8020.9032.761
    SPA-PLS850.9032.7940.9012.801
    Table 4. SPA-LS-SVM and SPA-PLS models for predicting TVB-N in salmon fillets by using the only 8 important wavelengths
    Jin-ping ZOU, Shuai ZHANG, Wen-tao DONG, Hai-liang ZHANG. Application of Hyperspectral Image to Detect the Content of Total Nitrogen in Fish Meat Volatile Base[J]. Spectroscopy and Spectral Analysis, 2021, 41(8): 2586
    Download Citation