
Mingrui Shao, Chang Ji, Jibing Tan, Baoqiang Du, Xiaofei Zhao, Jing Yu, Baoyuan Man, Kaichen Xu, Chao Zhang, Zhen Li. Ferroelectrically modulate the Fermi level of graphene oxide to enhance SERS response[J]. Opto-Electronic Advances, 2023, 6(11): 230094
- Opto-Electronic Advances
- Vol. 6, Issue 11, 230094 (2023)
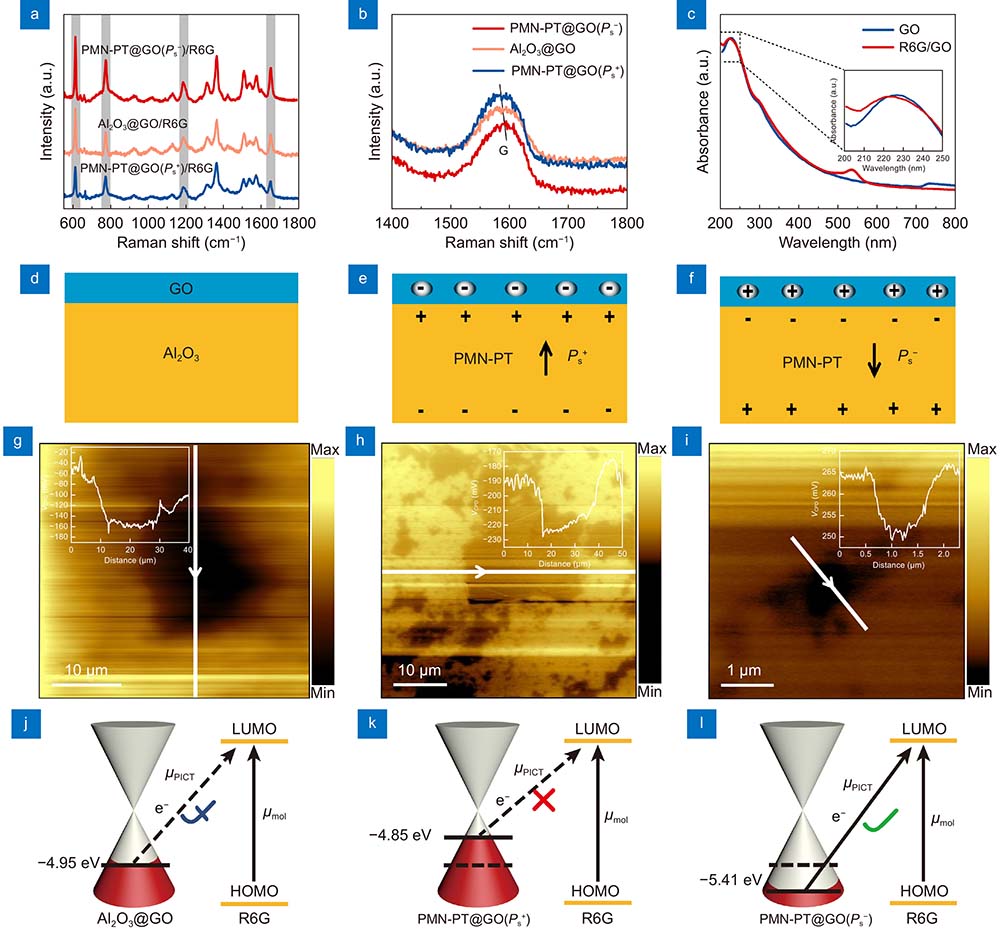
Fig. 1. (a ) SERS performance of Al2O3@GO, PMN-PT@GO (Ps+) and PMN-PT@GO(Ps−) by employing R6G as the probe molecule under excitation of 532 nm laser. (b ) Raman shift of G band of GO in Al2O3@GO, PMN-PT@GO (Ps+) and PMN-PT@GO(Ps−). (c ) UV-vis spectra of the GO and R6G/GO. (d -f ) Schematic diagram of GO doping when adsorbed on different surfaces of PMN-PT. (g -i ) Contact potential differences (VCPD) between Au probe and GO in (g) Al2O3@GO, (h) PMN-PT@GO (Ps+) and (i) PMN-PT@GO(Ps−) measured by a KPFM system. (j –l ) Modulation mechanism of SERS enhancement of (j) Al2O3@GO, (k) PMN-PT@GO (Ps+) and (l) PMN-PT@GO(Ps−).
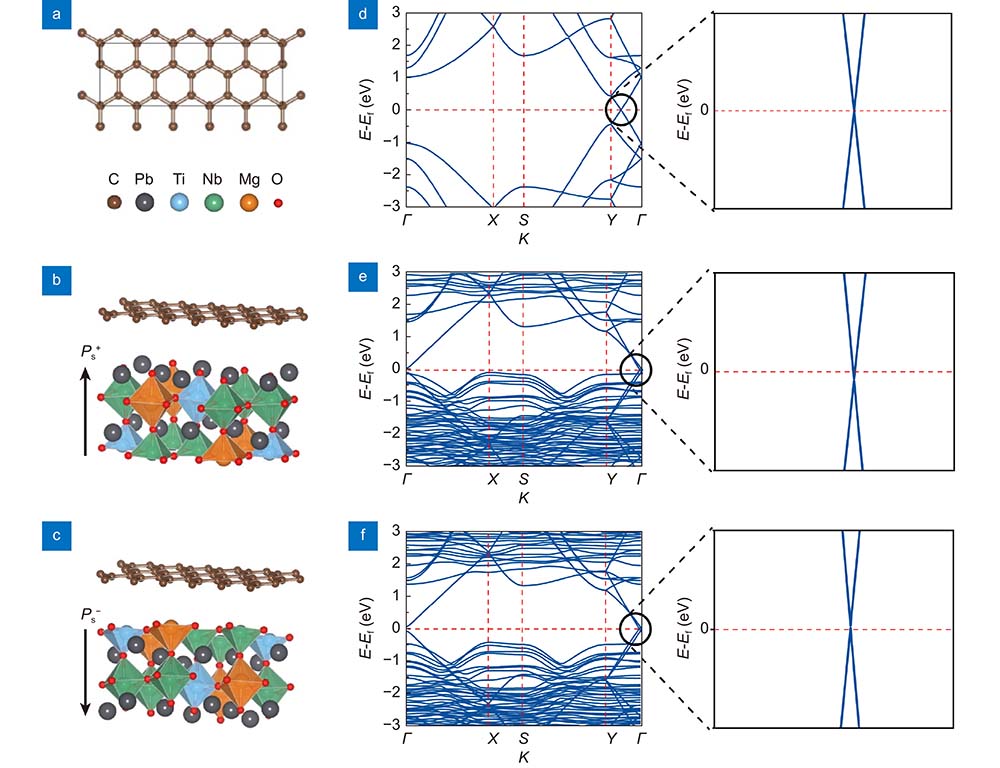
Fig. 2. Atomic structure of (a ) intrinsic graphene, (b ) graphene on up-polarized (Ps+) PMN-PT surface, (c ) graphene on down-polarized (Ps−) PMN-PT surface for DFT calculation. The electronic band structure of (d ) intrinsic graphene, (e ) graphene on up-polarized (Ps+) PMN-PT surface, (f ) graphene on down-polarized (Ps−) PMN-PT surface.
Fig. 3. (a , d ) The temperature-dependent SERS spectra of R6G by employing (a) PMN-PT@GO(Ps−), (d) Al2O3@GO as a SERS substrate. (b ) Schematic diagram of doping level of GO affected by PMN-PT@GO(Ps−) temperature. (c ) Schematic illustration of the energy band structure of PMN-PT@GO(Ps−)/R6G and the electron transition process under 532 nm excitation laser. (e , f ) SERS spectra of R6G with different concentrations on PMN-PT@GO(Ps−) at (e) 20 °C, (f) 0 °C. (g ) SERS spectra of R6G with different concentrations on Al2O3@GO at different temperature.
Fig. 4. (a ) SERS spectra of CV on PMN-PT@GO(Ps−) under excitation of 532 and 633 nm laser. (b ) Schematic diagram of doping level of GO affected by PMN-PT@GO(Ps−) temperature. (c , d ) Schematic illustration of the energy band structure of PMN-PT@GO(Ps−)/CV and the electron transition process under (c) 532 nm, (d) 633 nm excitation laser. (e , f ) SERS spectra of CV on PMN-PT@GO(Ps−) under excitation of (e) 532 nm, (f) 633 nm laser at different temperature.
Fig. 5. (a , b ) SERS spectra of PNTP on PMN-PT@GO(Ps−) under excitation of (a) 532 nm, (b) 633 nm laser at different temperature. (c ) Schematic diagram of doping level of GO affected by PMN-PT@GO(Ps−) temperature. (d , e ) Schematic illustration of the energy band structure of PMN-PT@GO(Ps−)/PNTP and the electron transition process under (d) 532 nm, (e) 633 nm excitation laser.

Set citation alerts for the article
Please enter your email address
© Copyright 2018-2021 | Chinese Laser Press. All Rights Reserved 沪ICP备15018463号-20