• Laser & Optoelectronics Progress
  • Vol. 58, Issue 19, 1914001 (2021)
Jing Zhang1、2、*, Lin Cheng1、2, Chuanxian Luo1、2, Yi Jiang1、2, and Youyi Shi1、2
Author Affiliations
  • 1NARI Group Corporation/State Grid Electric Power Research Institute, Nanjing , Jiangsu 211006, China
  • 2Wuhan NARI Co. Ltd., State Grid Electric Power Research Institute, Wuhan , Hubei 430074, China
  • show less
    DOI: 10.3788/LOP202158.1914001 Cite this Article Set citation alerts
    Jing Zhang, Lin Cheng, Chuanxian Luo, Yi Jiang, Youyi Shi. Nonlinear Amplification and Compression of Femtosecond Laser at 1560 nm via Divided-Pulse Technology[J]. Laser & Optoelectronics Progress, 2021, 58(19): 1914001 Copy Citation Text show less
    Evolution of pulse in optical fiber main amplifier. (a) When γ=0 and α=0, γ=3 and α=0, γ=3 and α=2, and γ=3 and α=4, pulse width changes with fiber length; (b) when fiber length is 2.5 m, 3.0 m, 3.5 m, and 4.0 m, pulse width changes with gain coefficient of fiber amplifier; (c) when fiber length (gain) is 2.5 m (24 dB), 3.5 m (18 dB), and 4.0 m (15 dB), the gain is 15 dB, pulse width changes with gain coefficient of fiber amplifier
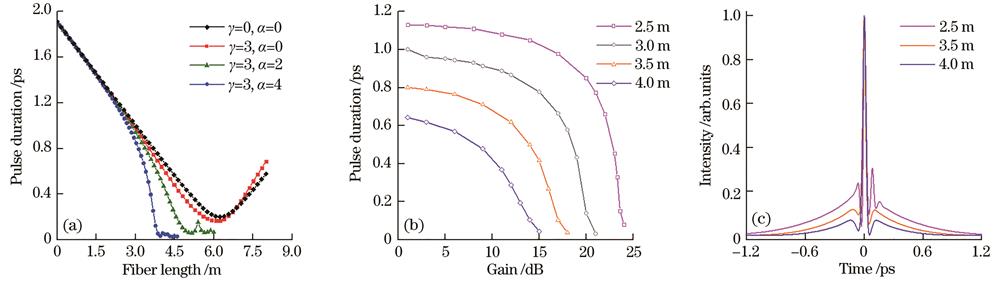
    Fig. 1. Evolution of pulse in optical fiber main amplifier. (a) When γ=0 and α=0, γ=3 and α=0, γ=3 and α=2, and γ=3 and α=4, pulse width changes with fiber length; (b) when fiber length is 2.5 m, 3.0 m, 3.5 m, and 4.0 m, pulse width changes with gain coefficient of fiber amplifier; (c) when fiber length (gain) is 2.5 m (24 dB), 3.5 m (18 dB), and 4.0 m (15 dB), the gain is 15 dB, pulse width changes with gain coefficient of fiber amplifier
    Schematic diagram of experimental device
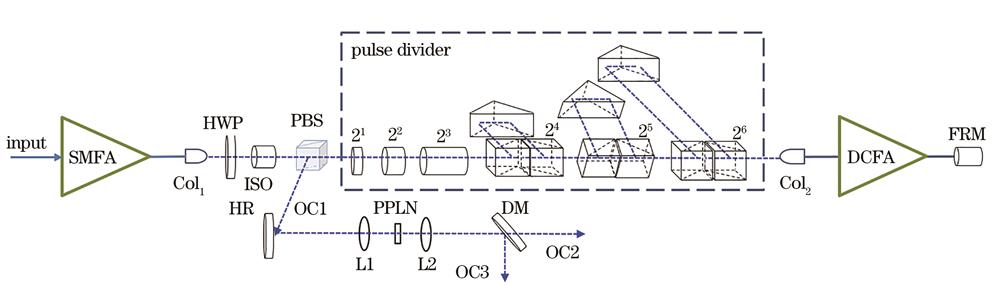
    Fig. 2. Schematic diagram of experimental device
    Experimental results. (a) Pulse spectrum output by single-mode fiber power amplifier (inset: autocorrelation curve); (b) partial autocorrelation curve of the sub-pulse train after 64 pulses are separated
    Fig. 3. Experimental results. (a) Pulse spectrum output by single-mode fiber power amplifier (inset: autocorrelation curve); (b) partial autocorrelation curve of the sub-pulse train after 64 pulses are separated
    Experimental results. (a) Output spectrum and (b) autocorrelation curve of main amplifier under low non-linearity condition; (c) output spectrum and (d) autocorrelation curve of main amplifier under high non-linearity condition
    Fig. 4. Experimental results. (a) Output spectrum and (b) autocorrelation curve of main amplifier under low non-linearity condition; (c) output spectrum and (d) autocorrelation curve of main amplifier under high non-linearity condition
    Experimental results. (a) Output spectrum of 778 nm pulse; (b) autocorrelation curve of 778 nm pulse; (c) power stability of 1560 nm pulse; (d) power stability of 778 nm pulse
    Fig. 5. Experimental results. (a) Output spectrum of 778 nm pulse; (b) autocorrelation curve of 778 nm pulse; (c) power stability of 1560 nm pulse; (d) power stability of 778 nm pulse
    Jing Zhang, Lin Cheng, Chuanxian Luo, Yi Jiang, Youyi Shi. Nonlinear Amplification and Compression of Femtosecond Laser at 1560 nm via Divided-Pulse Technology[J]. Laser & Optoelectronics Progress, 2021, 58(19): 1914001
    Download Citation