• Photonics Research
  • Vol. 12, Issue 4, 625 (2024)
He-Bin Zhang1、2, Gao-Xiang Li2、4、*, and Yong-Chun Liu1、3、5、*
Author Affiliations
  • 1State Key Laboratory of Low-Dimensional Quantum Physics, Department of Physics, Tsinghua University, Beijing 100084, China
  • 2Department of Physics, Huazhong Normal University, Wuhan 430079, China
  • 3Frontier Science Center for Quantum Information, Beijing 100084, China
  • 4e-mail: gaox@mail.ccnu.edu.cn
  • 5e-mail: ycliu@tsinghua.edu.cn
  • show less
    DOI: 10.1364/PRJ.514756 Cite this Article Set citation alerts
    He-Bin Zhang, Gao-Xiang Li, Yong-Chun Liu. Subnatural-linewidth fluorescent single photons[J]. Photonics Research, 2024, 12(4): 625 Copy Citation Text show less
    (a) Schematic diagram of the emitter and the detection setup. On the left is a Λ-shape emitter including ground states |g⟩ and |a⟩, and excited state |e⟩. The transitions |g⟩↔|e⟩ and |g⟩↔|a⟩ are driven by the external fields F1 and F2, respectively. Fluorescent photons emitted from the transition |e⟩→|a⟩ are collected by an HBT setup. Moreover, a spectral filter (SF) is inserted between the emitter and the HBT setup, and thus the filtering frequency and bandwidth determine the detection frequency and bandwidth, respectively. (b) Schematic diagram of the effective level system of the emitter in (a) in the weak excitation regime.
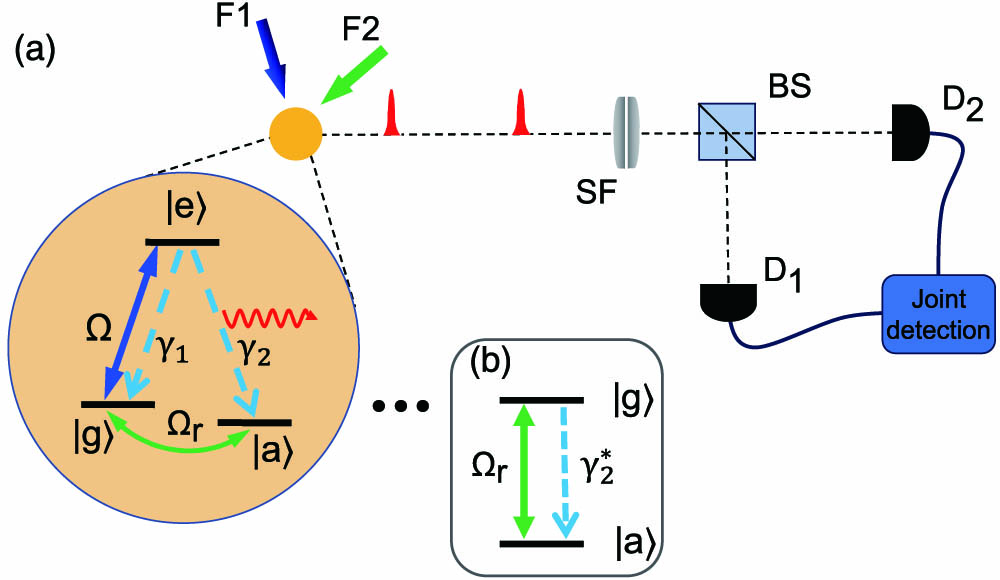
    Fig. 1. (a) Schematic diagram of the emitter and the detection setup. On the left is a Λ-shape emitter including ground states |g and |a, and excited state |e. The transitions |g|e and |g|a are driven by the external fields F1 and F2, respectively. Fluorescent photons emitted from the transition |e|a are collected by an HBT setup. Moreover, a spectral filter (SF) is inserted between the emitter and the HBT setup, and thus the filtering frequency and bandwidth determine the detection frequency and bandwidth, respectively. (b) Schematic diagram of the effective level system of the emitter in (a) in the weak excitation regime.
    Fluorescence spectrum (incoherent component) for the transition |e⟩↔|a⟩ with Ω=1/10γ, Ωr=10−2γ in (a), Ω=5×10⁻²γ, Ωr=10−2γ in (b), and Ω=10−2γ, Ωr=10−5γ in (c), respectively. (d) Normalized second-order correlation of the transition |e⟩→|a⟩ as a function of delay τ. The red solid line, blue dashed line, and green dot line correspond to the cases in (a)–(c), respectively. As a contrast, normalized second-order correlation of two-level system in the weak excitation regime is shown by black open circles.
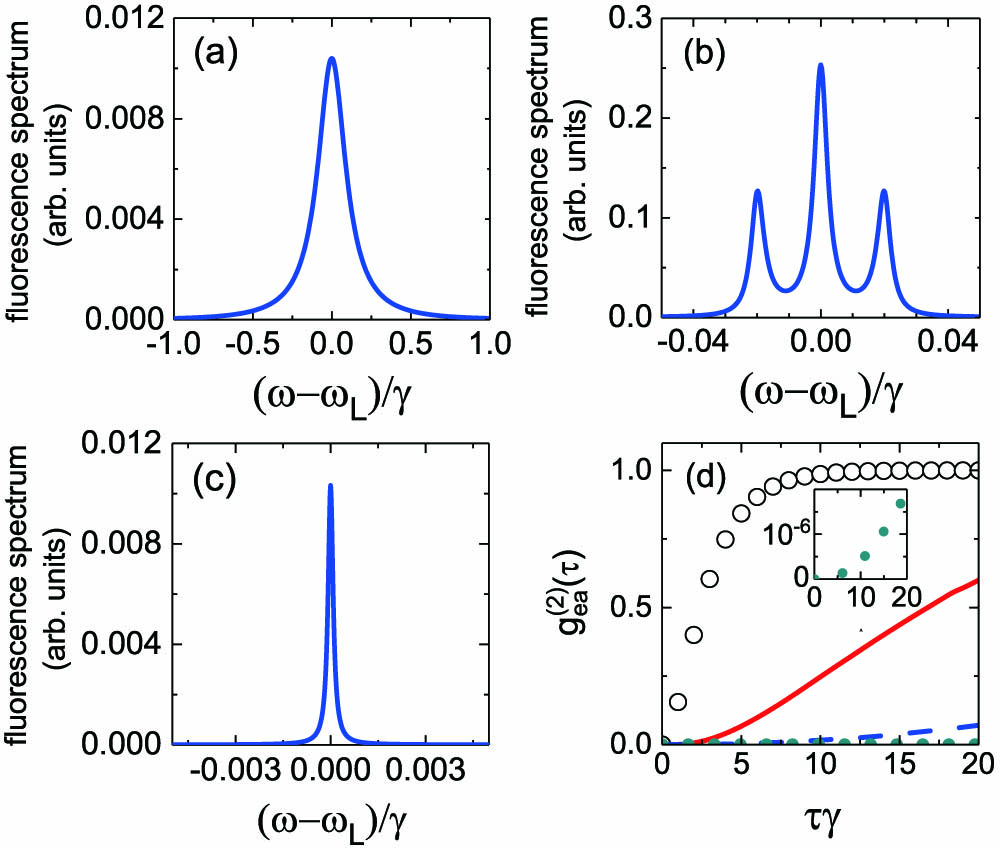
    Fig. 2. Fluorescence spectrum (incoherent component) for the transition |e|a with Ω=1/10γ, Ωr=102γ in (a), Ω=5×10²γ, Ωr=102γ in (b), and Ω=102γ, Ωr=105γ in (c), respectively. (d) Normalized second-order correlation of the transition |e|a as a function of delay τ. The red solid line, blue dashed line, and green dot line correspond to the cases in (a)–(c), respectively. As a contrast, normalized second-order correlation of two-level system in the weak excitation regime is shown by black open circles.
    Normalized two-photon correlations of the detector for the transition |e⟩→|a⟩ (a) as a function of κ and Ω with Ωr=Ω, and (b) as a function of κ (κ/γ*), with Ω=10−1γ and thus γ*=10−2γ. Normalized two-photon correlation of the detector for the two-level system in the weak excitation regime is shown as a contrast (black open circles).
    Fig. 3. Normalized two-photon correlations of the detector for the transition |e|a (a) as a function of κ and Ω with Ωr=Ω, and (b) as a function of κ (κ/γ*), with Ω=101γ and thus γ*=102γ. Normalized two-photon correlation of the detector for the two-level system in the weak excitation regime is shown as a contrast (black open circles).
    Emission rates of the subnatural-linewidth single photons (red solid line) and two-level system (blue dashed line) as functions of the Rabi frequencies Ωr and ΩT, respectively. In the region with the blue background, the emission rate of the subnatural-linewidth single photons almost reaches the upper limit. The inset shows the ratio of these two single-photon emission rates, providing γ*=Γ.
    Fig. 4. Emission rates of the subnatural-linewidth single photons (red solid line) and two-level system (blue dashed line) as functions of the Rabi frequencies Ωr and ΩT, respectively. In the region with the blue background, the emission rate of the subnatural-linewidth single photons almost reaches the upper limit. The inset shows the ratio of these two single-photon emission rates, providing γ*=Γ.
    Comparison of analytical and numerical results of fluorescence spectrum. The analysis results (solid line) of the fluorescence spectrum (incoherent component) according to Eq. (26) in (a) and (c) and Eq. (32) in (b) are compared to the numerical results (dotted line) to verify the accuracy of the theory in this section. The parameters applied in (a)–(c) are the same as that in Figs. 2(a)–2(c), respectively.
    Fig. 5. Comparison of analytical and numerical results of fluorescence spectrum. The analysis results (solid line) of the fluorescence spectrum (incoherent component) according to Eq. (26) in (a) and (c) and Eq. (32) in (b) are compared to the numerical results (dotted line) to verify the accuracy of the theory in this section. The parameters applied in (a)–(c) are the same as that in Figs. 2(a)–2(c), respectively.
    (a) Comparison of the analytical and numerical results of the correlation function gea(2)(τ). The analytical results (solid circles) of the correlation function according to Eq. (36) are compared to the numerical results shown in Fig. 2(d) to verify the accuracy of the theory in this section. (b) Evolution of gea(2)(τ) over a time scale greater than γ*−1 with Ω=10−1γ and thus γ*=10−2γ.
    Fig. 6. (a) Comparison of the analytical and numerical results of the correlation function gea(2)(τ). The analytical results (solid circles) of the correlation function according to Eq. (36) are compared to the numerical results shown in Fig. 2(d) to verify the accuracy of the theory in this section. (b) Evolution of gea(2)(τ) over a time scale greater than γ*1 with Ω=101γ and thus γ*=102γ.
    Fluorescence properties and the detection response of the emission from the transition |e⟩→|a⟩ with a detuning Δe between the transition |g⟩↔|e⟩ and the laser F1. (a) Fluorescence spectrum with Δe=2γ, (b) two-photon correlation gs(2)(0), and (c) emission rate IN of the single photons as a function of Δe. The detection bandwidth satisfies κ=0.5γ in (b), and the other parameters in (a)–(c) are the same as in Fig. 2(a).
    Fig. 7. Fluorescence properties and the detection response of the emission from the transition |e|a with a detuning Δe between the transition |g|e and the laser F1. (a) Fluorescence spectrum with Δe=2γ, (b) two-photon correlation gs(2)(0), and (c) emission rate IN of the single photons as a function of Δe. The detection bandwidth satisfies κ=0.5γ in (b), and the other parameters in (a)–(c) are the same as in Fig. 2(a).
    Schematic diagram of generating subnatural-linewidth single photons based on the transition Fg=1→Fe=0 of the D2 line of R87b. (a) The level configuration for the transition Fg=1→Fe=0, where the transitions from the ground and excited states and between the ground-state Zeeman sublevels are, respectively, driven by the σ+-polarized laser field (E) and the transverse magnetic field (BT). Two main long-period transition loops involved in (a) are exhibited in (b) and (c), which dominate the emission from the spontaneous decays |0,0⟩→|1,0⟩ and |0,0⟩→|1,1⟩, respectively. (d) Schematic diagram of the effective three-level system of the emitter in (a) in the weak excitation regime.
    Fig. 8. Schematic diagram of generating subnatural-linewidth single photons based on the transition Fg=1Fe=0 of the D2 line of R87b. (a) The level configuration for the transition Fg=1Fe=0, where the transitions from the ground and excited states and between the ground-state Zeeman sublevels are, respectively, driven by the σ+-polarized laser field (E) and the transverse magnetic field (BT). Two main long-period transition loops involved in (a) are exhibited in (b) and (c), which dominate the emission from the spontaneous decays |0,0|1,0 and |0,0|1,1, respectively. (d) Schematic diagram of the effective three-level system of the emitter in (a) in the weak excitation regime.
    Fluorescence properties and detection response of the emission from the transition Fg=1→Fe=0 of the D2 line of R87b. The spectral property, second-ordering correlation, and detection response for the fluorescent photon emitted from the transitions |0,0⟩→|1,0⟩ and |0,0⟩→|1,1⟩ are, respectively, exhibited in (a)–(c) and (d)–(f). In (a) and (d), the fluorescence spectrum for ΩB=10−2Y and Veg−1=10−1Y. In (b) and (e), normalized second-ordering correlations as a function of delay τ for ΩB=10−2Y and Veg−1=10−1Y donated by red solid lines, and ΩB=10−2Y and Veg−1=10−2Y donated by blue dashed lines. In (c) and (f), normalized two-photon correlations of the detector as a function of detection bandwidth κ and the interaction energies of coherent fields with ΩB=Veg−1.
    Fig. 9. Fluorescence properties and detection response of the emission from the transition Fg=1Fe=0 of the D2 line of R87b. The spectral property, second-ordering correlation, and detection response for the fluorescent photon emitted from the transitions |0,0|1,0 and |0,0|1,1 are, respectively, exhibited in (a)–(c) and (d)–(f). In (a) and (d), the fluorescence spectrum for ΩB=102Y and Veg1=101Y. In (b) and (e), normalized second-ordering correlations as a function of delay τ for ΩB=102Y and Veg1=101Y donated by red solid lines, and ΩB=102Y and Veg1=102Y donated by blue dashed lines. In (c) and (f), normalized two-photon correlations of the detector as a function of detection bandwidth κ and the interaction energies of coherent fields with ΩB=Veg1.
    Schematic diagrams of generating subnatural-linewidth single photons based on transitions (a) Fg=2→Fe=1 and (b) Fg=1→Fe=1. The transitions between the ground states and the excited states are driven by a σ+-polarized laser field, and photons with different polarizations are emitted by spontaneous decays. A transverse magnetic field is applied to drive the transitions between the ground-state Zeeman sublevels (the driving between the excited-state Zeeman sublevels is weak compared to the spontaneous emission process, and thus is ignorable). By choosing the fluorescent photon with a polarization different from the laser as the target photon, the single photons with subnatural linewidth are generated.
    Fig. 10. Schematic diagrams of generating subnatural-linewidth single photons based on transitions (a) Fg=2Fe=1 and (b) Fg=1Fe=1. The transitions between the ground states and the excited states are driven by a σ+-polarized laser field, and photons with different polarizations are emitted by spontaneous decays. A transverse magnetic field is applied to drive the transitions between the ground-state Zeeman sublevels (the driving between the excited-state Zeeman sublevels is weak compared to the spontaneous emission process, and thus is ignorable). By choosing the fluorescent photon with a polarization different from the laser as the target photon, the single photons with subnatural linewidth are generated.
    He-Bin Zhang, Gao-Xiang Li, Yong-Chun Liu. Subnatural-linewidth fluorescent single photons[J]. Photonics Research, 2024, 12(4): 625
    Download Citation