• Laser & Optoelectronics Progress
  • Vol. 56, Issue 23, 232501 (2019)
Jiaqiao Zhou1、2、3、**, Wennan Cui1、*, Tao Zhang1、***, Xiayang Huang1、4, and Zhouchun Wang1、3
Author Affiliations
  • 1Key Laboratory of Intelligent Infrared Perception, Shanghai Institute of Technical Physics, Chinese Academy of Sciences, Shanghai 200083, China
  • 2University of Chinese Academy of Sciences, Beijing 100049, China
  • 3Shanghai Tech University, Shanghai 201210, China
  • 4Shanghai University, Shanghai 200444, China
  • show less
    DOI: 10.3788/LOP56.232501 Cite this Article Set citation alerts
    Jiaqiao Zhou, Wennan Cui, Tao Zhang, Xiayang Huang, Zhouchun Wang. Adaptive Band Selection Technique Based on Spectral Measurement Data[J]. Laser & Optoelectronics Progress, 2019, 56(23): 232501 Copy Citation Text show less
    Flowchart of band selection
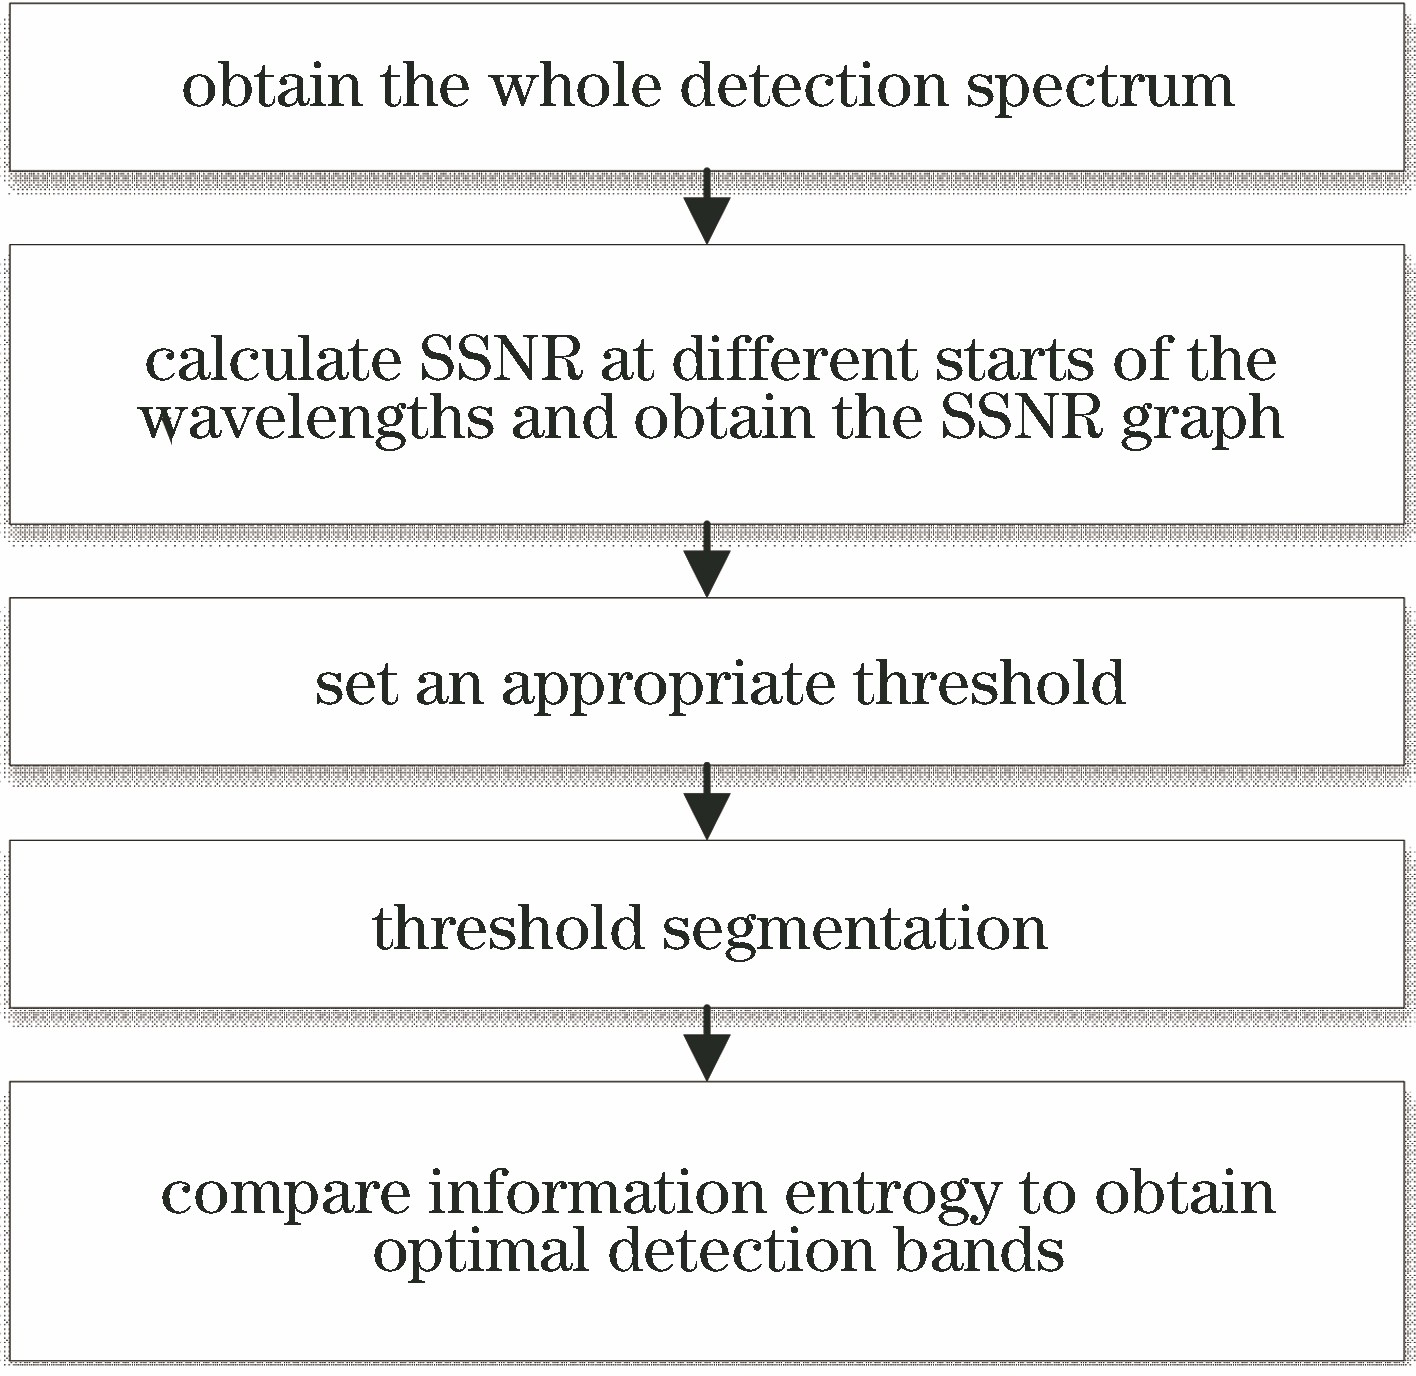
    Fig. 1. Flowchart of band selection
    Flowchart of Fourier spectral data processing
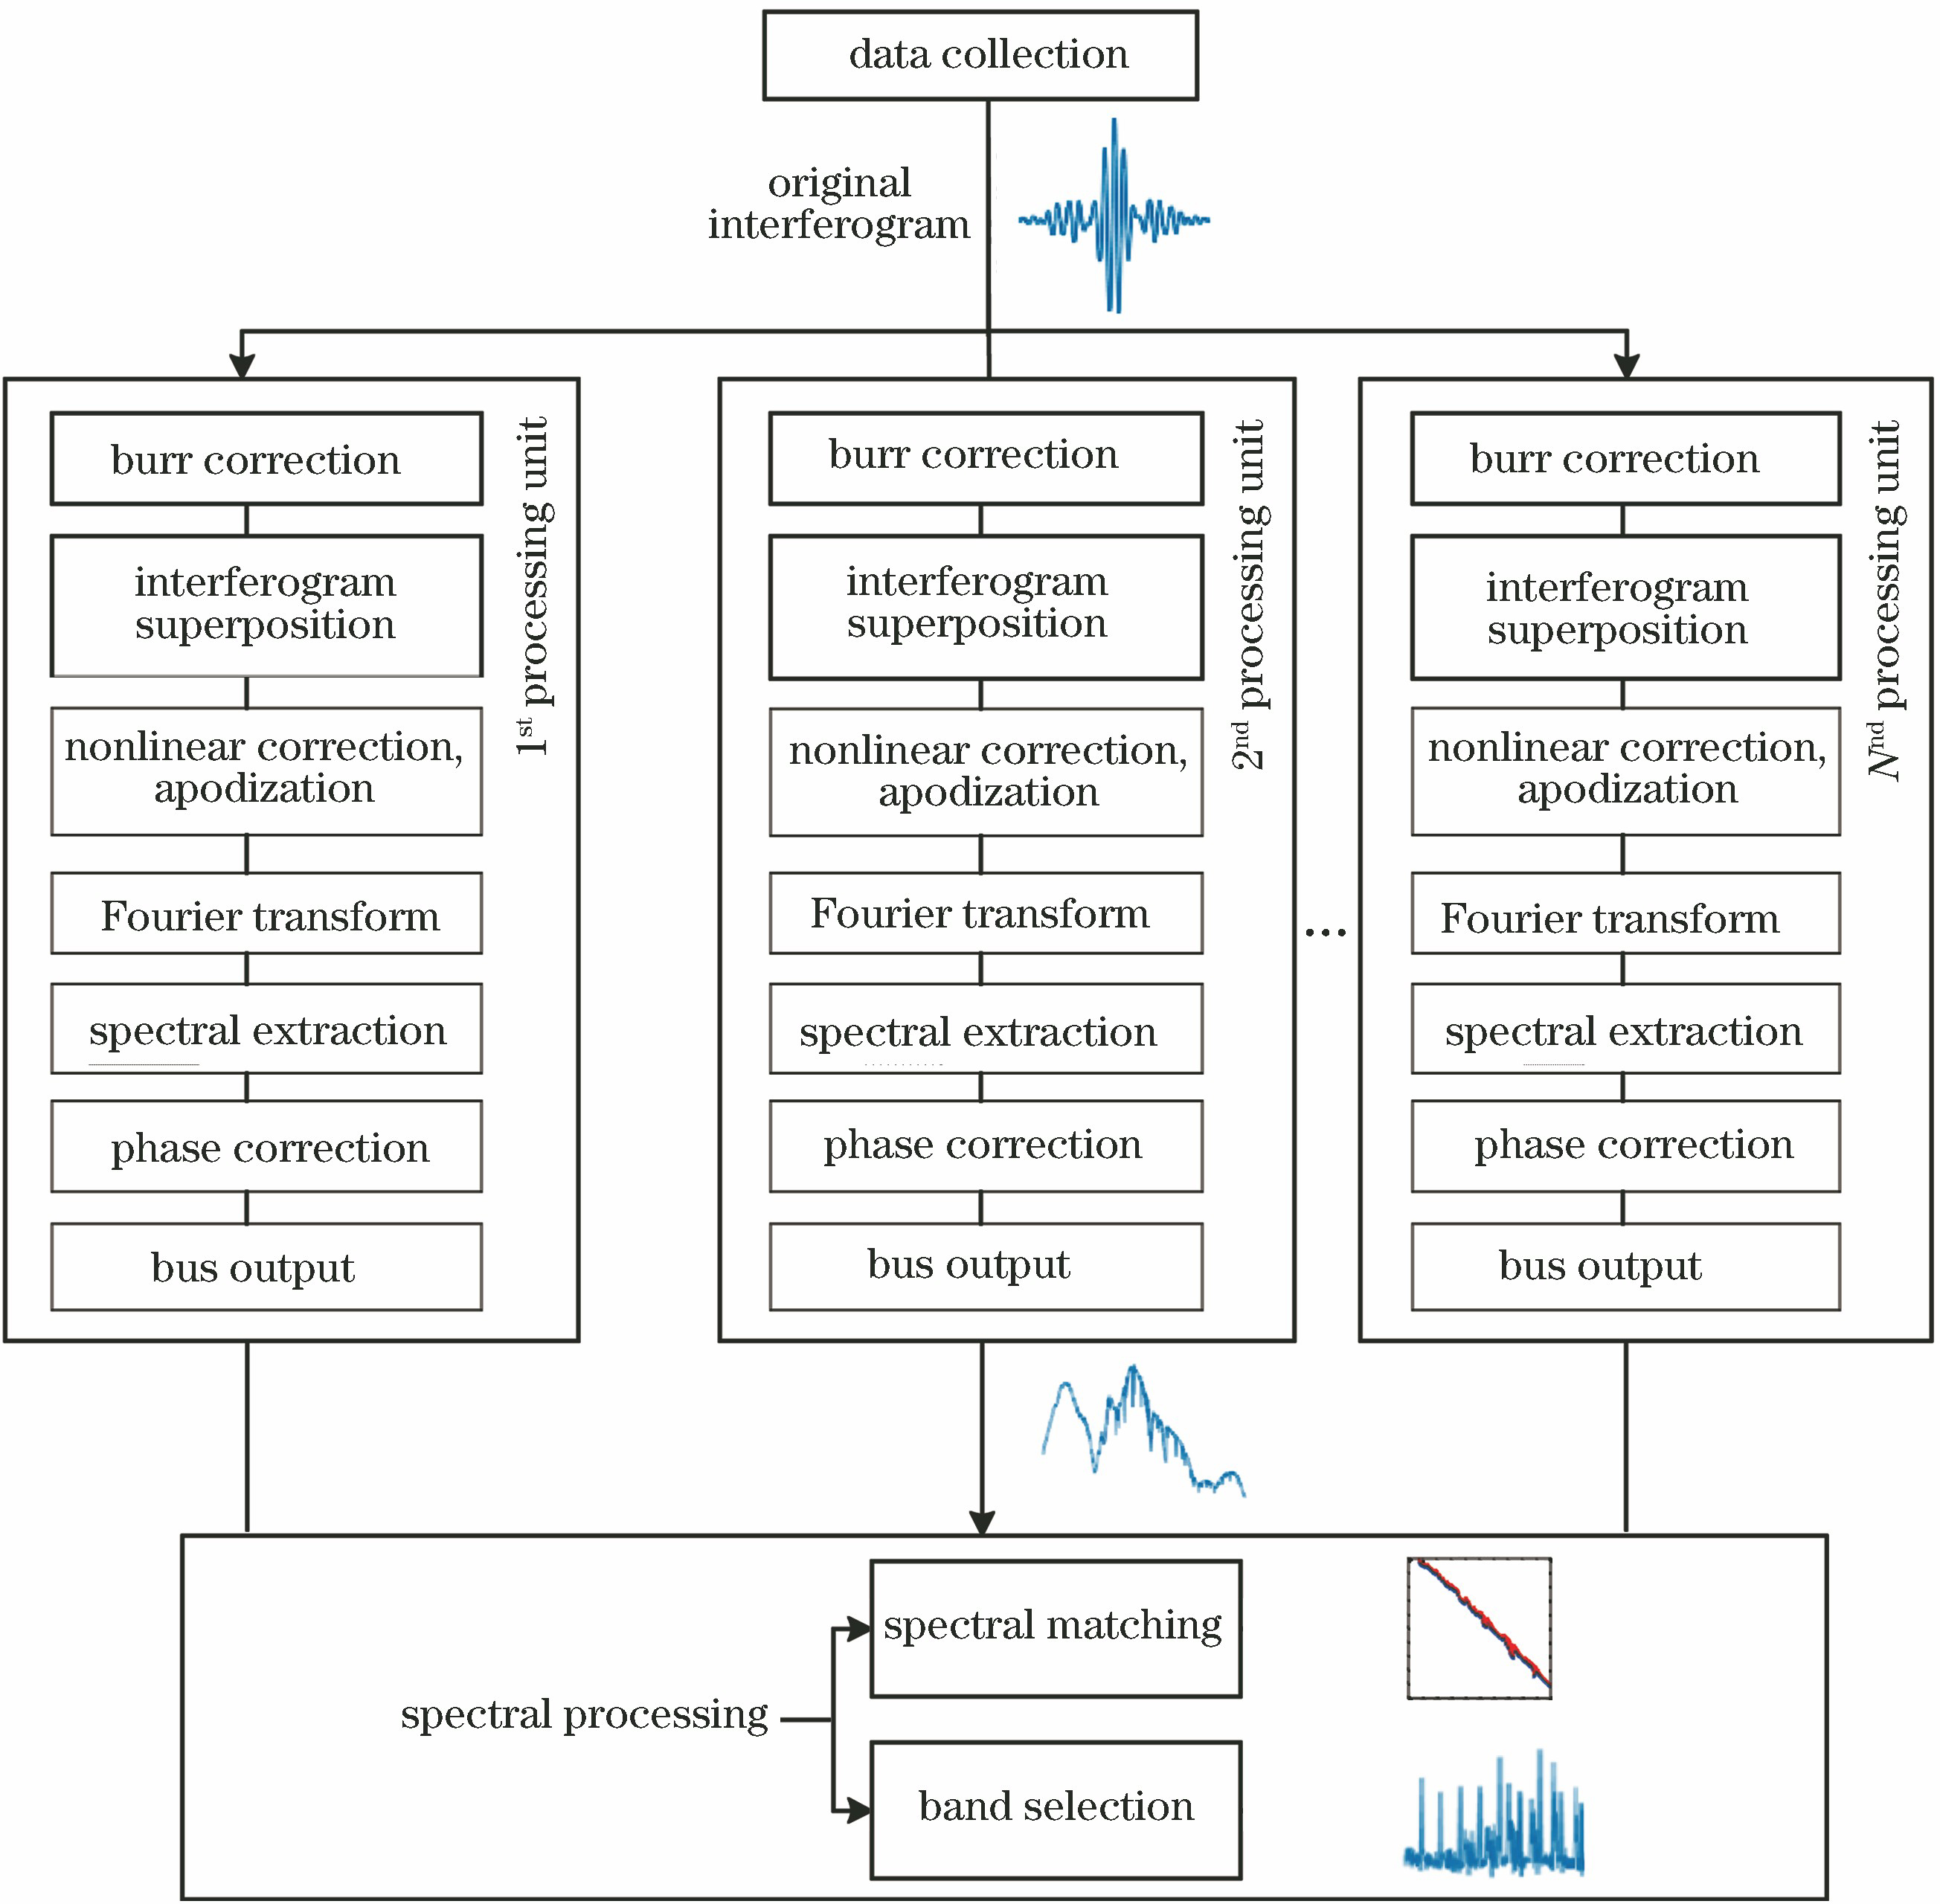
    Fig. 2. Flowchart of Fourier spectral data processing
    UAV target detection image
    Fig. 3. UAV target detection image
    Spectral curves of different objects. (a) UAV; (b) plastic bag
    Fig. 4. Spectral curves of different objects. (a) UAV; (b) plastic bag
    SSNR curves of different objects. (a) UAV; (b) plastic bag
    Fig. 5. SSNR curves of different objects. (a) UAV; (b) plastic bag
    Single-channel detection images of plastic bag carried by UAV
    Fig. 6. Single-channel detection images of plastic bag carried by UAV
    Box detection picture
    Fig. 7. Box detection picture
    Spectra and SSNR curves of box with different scan intervals. (a) 5 nm scan interval, spectral curve; (b) 5 nm scan interval, SSNR curve; (c) 10 nm scan interval, spectral curve; (d) 10 nm scan interval, SSNR curve
    Fig. 8. Spectra and SSNR curves of box with different scan intervals. (a) 5 nm scan interval, spectral curve; (b) 5 nm scan interval, SSNR curve; (c) 10 nm scan interval, spectral curve; (d) 10 nm scan interval, SSNR curve
    Single-channel detection images of box
    Fig. 9. Single-channel detection images of box
    Doll detection picture
    Fig. 10. Doll detection picture
    Spectral curve and SSNR curve of doll with 5 nm scan interval. (a) Spectral curve; (b) SSNR curve
    Fig. 11. Spectral curve and SSNR curve of doll with 5 nm scan interval. (a) Spectral curve; (b) SSNR curve
    Single-channel detection images of doll
    Fig. 12. Single-channel detection images of doll
    Band rangeWorkingdistanceField ofviewFocallengthScanstepSpectralresolutionSpatialresolution
    400-1000 nm0.5 m to ∞ (according to the lens)3°-10°28-150 mm(adjustable)can be selectedas needed2-10 nm806 pixel×606 pixel
    Table 1. Parameters of AOTF spectrometer
    Jiaqiao Zhou, Wennan Cui, Tao Zhang, Xiayang Huang, Zhouchun Wang. Adaptive Band Selection Technique Based on Spectral Measurement Data[J]. Laser & Optoelectronics Progress, 2019, 56(23): 232501
    Download Citation