Author Affiliations
1Key Laboratory of Water Cycle and Related Land Surface Processes, Institute of Geographic Sciences and Natural Resources Research, CAS, Beijing 100101, China2University of Chinese Academy of Sciences, Beijing 100049, Chinashow less
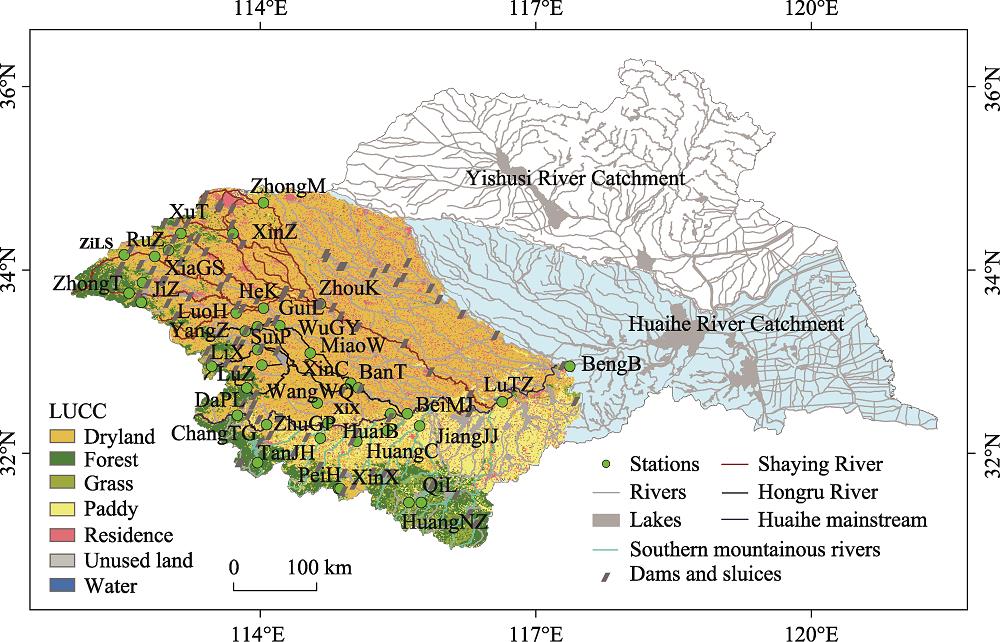
Fig. 1. Locations of the Huaihe River Basin, selected hydrological stations, dams and sluices
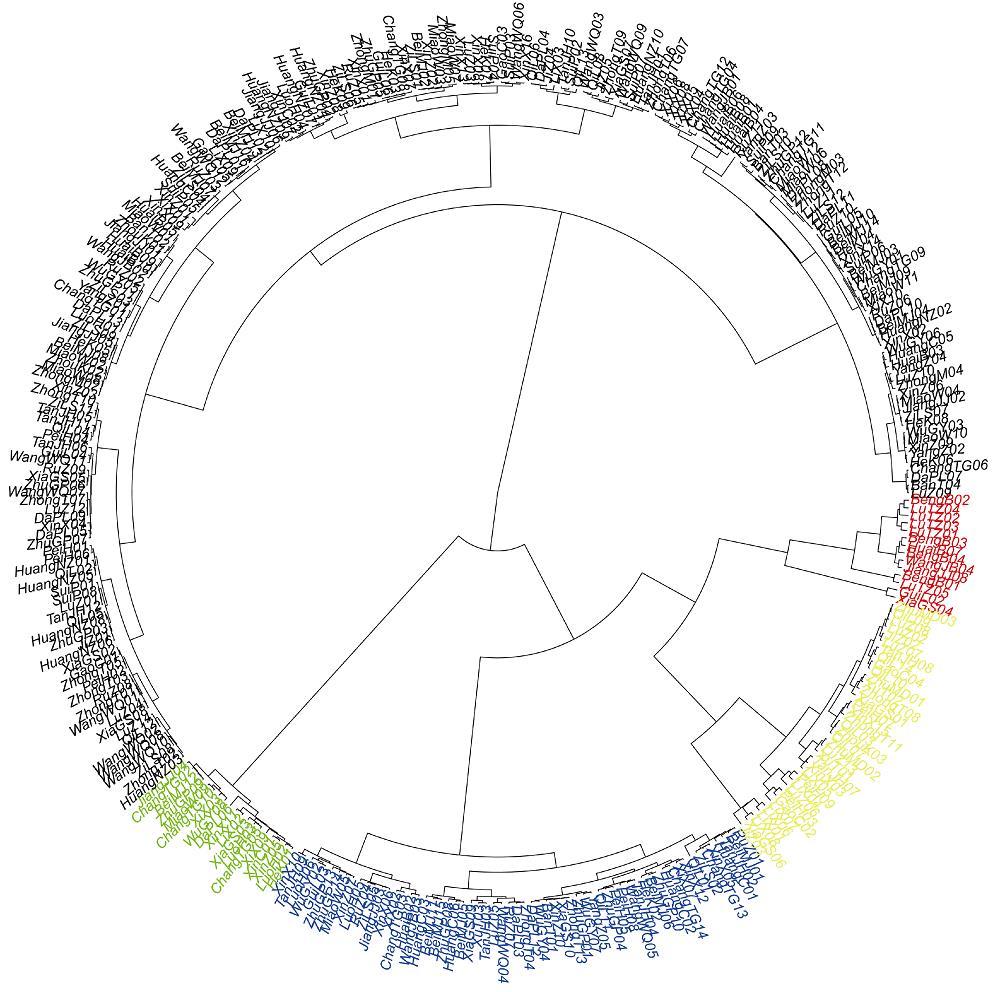
Fig. 2. Hierarchical clustering results presented by black, red, yellow, blue and green colors for all the flood events named by station name+ event sequence which is sorted in chronological order (e.g., ZiLS01 means the first event at ZiL station)
Fig. 3. Classification performance assessment using the Goodman-Kruskal index (GKI), C index (CI) and minimum cluster for different total class numbers
Fig. 4. Normalized flood hydrographs of individual flood event classes (a-e) and their frequencies of flood events in the pre-flood, flood and post-flood seasons
Fig. 5. Variations of individual flood behavior metrics among different classes. Median values are defined by the solid dot symbols, respectively. Each black box illustrates the 25th and 75th percentile values, and the vertical line defines the minimum and maximum values without outliers. The white dot means the 50th percentile value and the violin shape means the frequency distribution of flood behavior metric.
Fig. 6. Spatial variations of different flood event classes
Fig. 7. Interannual distributions of flood event classes from 2006 to 2015 in the Shaying River, Hongru River, Southern mountainous rivers, Huaihe mainstream and for all the flood events
Fig. 8. Correlation coefficients between impact factors and flood behavior metrics (the blank column means insignificant impact factor)
Fig. 9. Contributions of impact categories and their combinations on the regional and interannual variations of individual flood event classes
| ID | Rivers | Stations | Dam regulation | Catchment area (km2) | Slope length (km) | Slope (%) | Elevation (m) | River density (km/km2) | Major land use (%) | Flood events | Precipitation (mm) | Potential evapotranspiration (mm) |
|---|
| 1 | Shaying River | ZiLS | / | 1800 | 89.4 | 22.15 | 818.3 | 0.027 | Forest (67.6) | 12 | 80.0±76.3 | 36.9±18.0 | | 2 | ZhongT | / | 485 | 41.4 | 29.07 | 680.2 | 0.019 | Forest (77.5) | 13 | 71.0±55.2 | 26.7±13.8 | | 3 | XiaGS | Yes | 354 | 36.9 | 19.67 | 471.0 | 0.083 | Forest (45.0) | 10 | 54.4±36.9 | 32.2±21.5 | | 4 | RuZ | Yes | 3005 | 73.4 | 16.54 | 662.2 | 0.016 | Forest (45.8) | 11 | 54.0±27.1 | 42.8±19.3 | | 5 | GaoC | Yes | 627 | 49.1 | 13.98 | 493.8 | 0.055 | Dryland (58.4) | 5 | 57.2±68.1 | 42.5±32.3 | | 6 | ZhongM | / | 2106 | 132.3 | 1.28 | 144.3 | 0.027 | Dryland (53.4) | 5 | 65.9±51.8 | 34.7±8.3 | | 7 | JiZ | / | 46 | 10.5 | 16.16 | 394.0 | 0.023 | Forest (73.9) | 5 | 54.4±87.7 | 18.7±9.8 | | 8 | XinZ | Yes | 1079 | 75.5 | 5.37 | 268.4 | 0.027 | Dryland (63.6) | 10 | 134.1±80.6 | 65.7±68.1 | | 9 | HeK | Yes | 2124 | 116.4 | 3.32 | 153.1 | 0.004 | Dryland (72.4) | 9 | 57.2±35.4 | 38.0±14.8 | | 10 | LuoH | Yes | 12,150 | 170.0 | 7.75 | 316.5 | 0.002 | Dryland (59.7) | 6 | 45.3±34.3 | 44.9±12.0 | | 11 | ZhouK | Yes | 25,800 | 202.1 | 4.47 | 214.9 | 0.001 | Dryland (67.5) | 3 | 54.1±52.6 | 44.6±41.8 | | 12 | Hongru River | XuT | / | 70 | 13.9 | 22.67 | 554.1 | 0.430 | Dryland (61.4) | 3 | 64.1±57.6 | 26.9±18.7 | | 13 | SuiP | Yes | 1760 | 96.4 | 5.08 | 164.9 | 0.030 | Dryland (59.4) | 9 | 67.5±37.1 | 23.0±28.4 | | 14 | YangZ | Yes | 1037 | 61.5 | 4.23 | 141.9 | 0.122 | Dryland (65.4) | 5 | 12.8±14.0 | 26.0±14.8 | | 15 | WuGy | Yes | 1564 | 107.8 | 2.37 | 105.9 | 0.054 | Dryland (73.2) | 8 | 38.3±46.2 | 36.7±17.0 | | 16 | LiX | / | 78 | 18.0 | 6.50 | 175.5 | 0.095 | Dryland (38.0) | 10 | 39.8±32.9 | 24.6±26.3 | | 17 | ZhuMD | / | 104 | 17.8 | 2.74 | 105.3 | 0.113 | Dryland (75.0) | 3 | 37.5±31.1 | 10.2±4.1 | | 18 | MiaoW | Yes | 2660 | 95.2 | 1.39 | 81.4 | 0.026 | Dryland (77.8) | 12 | 43.4±52.4 | 47.6±16.8 | | 19 | LuZ | / | 396 | 38.4 | 9.50 | 214.7 | 0.031 | Forest (56.5) | 14 | 24.7±29.3 | 18.4±9.9 | | ID | Rivers | Stations | Dam regulation | Catchment area (km2) | Slope length (km) | Slope (%) | Elevation (m) | River density (km/km2) | Major land use (%) | Flood events | Precipitation (mm) | Potential evapotranspiration (mm) | | 20 | | XinC | Yes | 4110 | 178.5 | 0.86 | 66.2 | 0.043 | Dryland (79.8) | 2 | 71.1±10.6 | 60.7±1.6 | | 21 | BanT | Yes | 11,280 | 197.6 | 1.69 | 88.5 | 0.008 | Dryland (74.2) | 4 | 18.6±26.1 | 34.9±28.8 | | 22 | GuiL | Yes | 1050 | 57.6 | 3.76 | 133.3 | 0.108 | Dryland (67.0) | 6 | 31.1±38.1 | 31.5±10.4 | | 23 | Southern mountainous rivers | TanJH | / | 152 | 24.3 | 20.33 | 279.9 | 0.040 | Forest (88.2) | 12 | 81.2±54.9 | 25.7±12.7 | | 24 | ZhuGP | Yes | 1639 | 94.2 | 7.11 | 159.8 | 0.036 | Forest (43.6) | 14 | 75.6±66.0 | 51.4±19.9 | | 25 | XinX | Yes | 274 | 31.5 | 19.40 | 286.1 | 0.071 | Dryland (57.7) | 16 | 79.2±54.1 | 42.8±32.2 | | 26 | HuangNZ | / | 805 | 48.9 | 24.03 | 487.4 | 0.006 | Forest (46.5) | 10 | 25.1±34.5 | 24.5±9.6 | | 27 | QiL | / | 185 | 31.4 | 26.65 | 531.5 | 0.006 | Forest (58.3) | 14 | 29.6±31.2 | 15.6±6.6 | | 28 | HuangC | Yes | 2050 | 117.9 | 6.76 | 156.7 | 0.036 | Dryland (47.7) | 6 | 52.2±30.1 | 84.6±38.7 | | 29 | BeiMJ | / | 1710 | 111.6 | 2.88 | 101.9 | 0.037 | Paddy (47.7) | 16 | 73.4±37.7 | 56.1±17.2 | | 30 | JiangJJ | Yes | 5930 | 161.2 | 11.99 | 246.6 | 0.008 | Forest (36.5) | 8 | 54.5±34.3 | 61.8±30.6 | | 31 | PeiH | Yes | 18 | 8.6 | 30.98 | 390.3 | 0.167 | Forest (100.0) | 9 | 87.9±54.2 | 22.6±12.4 | | 32 | Huaihe mainstream | DaPL | Yes | 1640 | 70.0 | 6.68 | 218.2 | 0.111 | Forest (45.9) | 13 | 58.1±36.6 | 44.9±21.5 | | 33 | ChangTG | Yes | 3090 | 78.0 | 5.51 | 185.5 | 0.031 | Dryland (41.1) | 14 | 79.6±45.9 | 53.4±22.9 | | 34 | XiX | Yes | 10,190 | 124.7 | 4.86 | 148.2 | 0.008 | Dryland (36.2) | 10 | 84.5±46.0 | 75.8±24.5 | | 35 | HuaiB | Yes | 16,005 | 138.7 | 3.93 | 125.0 | 0.005 | Dryland (43.2) | 10 | 60.2±43.1 | 96.1±46.4 | | 36 | LuTZ | Yes | 88,630 | 232.3 | 4.14 | 147.7 | 0.001 | Dryland (54.3) | 5 | 73.6±70.8 | 73.7±46.4 | | 37 | BengB | Yes | 121,330 | 279.3 | 3.23 | 123.6 | 0.001 | Dryland (57.2) | 4 | 46.53±39.7 | 47.7±31.4 | | 38 | WangWQ | Yes | 200 | 33.2 | 0.91 | 63.3 | 0.131 | Dryland (91.4) | 12 | 28.8±27.5 | 24.3±11.9 | | 39 | WangJB | Yes | 30,630 | 159.8 | 2.77 | 104.5 | 0.003 | Dryland (56.6) | 4 | 107.1±59.1 | 113.6±22.4 |
|
Table 1. The general characteristics of controlled catchments, and the selected flood events
| Categories | Behavior metrics | Abbreviation | Unit | Calculation equation |
|---|
| Magnitude | Total amount of flood | Rsum | mm | ${{{R}_{sum}}=86.4\cdot {{10}^{-3}}\cdot {{Q}_{sum}}}/{A}\;={86.4\cdot {{10}^{-3}}\cdot \sum\limits_{t=tbegin}^{tend}{{{Q}_{t}}}}/{A}\;$ | | Maximum peak flood | Qpk | none | ${{{Q}_{pk}}={{{Q}_{t,\max }}}/{{{Q}_{sum}}}\;=\max ({{Q}_{t}})}/{{{Q}_{sum}}}\;$ | | Duration | Flood event duration | Tduration | d | ${{T}_{duration}}={{F}_{end}}-{{F}_{begin}}+1$ | | Timing | Timing of flood event | Fbegin | d | ${{{T}_{pk}}=({{F}_{pk,\max }}-{{F}_{begin}}+1)}/{{{T}_{duration}}}\;$ | | Timing of maximum peak flood | Tpk | none | | Rate of changes | Mean rate of positive changes | RQrise | 1/hr | $R{{Q}_{rise}}=\frac{({{Q}_{t,\max }}-{{Q}_{Fbegin}})}{[{{Q}_{sum}}\cdot ({{t}_{pk,\max }}-{{F}_{begin}})\cdot 24]}$ | | Mean rate of negative changes | RQdown | 1/hr | $R{{Q}_{down}}=\frac{({{Q}_{t,\max }}-{{Q}_{Fend}})}{[{{Q}_{sum}}\cdot ({{F}_{end}}-{{t}_{pk,\max }}+1)\cdot 24]}$ | | Flood forms | Number of peak flood | Npk | none | $CV={\sigma }/{{{Q}_{av}}}\;$ | | Coefficient of variation | CV | none |
|
Table 2. Flood behavior metrics used for flood event descriptions
| Factor categories | Factors | Flood event implications |
|---|
| Geography | Location | Longitude and latitude (Long and Latt) | All the behavior categories | | Catchment | Area (Cat_A, km2), average elevation (Cat_ae, m), slope (Cat_slp, %) and length (Cat_len, km) | Magnitude, rate of changes and forms | | River | Slope (Rch_slp, %) and length (Rch_len, km), with-depth ratio (Rch_wdr, m/m), river density (Rch_den, km/km2) | Magnitude, rate of changes and forms | | Land use | Land use area | Paddy (Lu_pad, km2), dryland (Lu_dry, km2), forest (Lu_fst, km2), grass (Lu_grs, km2), water (Lu_wat, km2), urban (Lu_urb, km2) and unused land (Lu_uns, km2) | Magnitude, rate of changes and forms | | Hydrometeoro- logy | Precipitation | Cumulative amount in the antecedent three, five and seven days (Pcp_3d, Pcp_5d, Pcp_7d, mm) and during the flood event (Pcp_tot, mm), annual amount (Pcp_ann, mm) and ratio of flood season (R_fldpcp) | All the behavior categories | | Potential evapotranspiration | Cumulative amount in the antecedent three, five and seven days (Pet_3d, Pet_5d and Pet_7d, mm) and during the flood event (Pet_tot, mm), annual amount (Pet_ann, mm) and ratio of flood season (R_fldpet) | Magnitude | | Baseflow | Baseflow index (BFI) | Magnitude, duration and forms | | Human regulation | Water storage project | Number (Num_rsv), total and beneficial capacities (Tot_rsv and Use_rsv, 108 m3), and their ratios of annual average runoff magnitude (R_totrsv and R_usersv) | All the behavior categories | | Water diversion project | Number (Num_wdp) and total capacities (Tot_wdp, 108 m3) | Magnitude | | Water pumping project | Number (Num_wpp) and total capacities (Tot_wpp, 108 m3 | Magnitude | | Water transferring project | Total capacity (Tot_wtp, 108 m3) | Magnitude |
|
Table 3. Potential impact factor categories used to analyze the space and time variations of flood events