1Key Laboratory of Water Cycle and Related Land Surface Processes, Institute of Geographic Sciences and Natural Resources Research, CAS, Beijing 100101, China
2University of Chinese Academy of Sciences, Beijing 100049, China
Yongyong ZHANG, Qiutan CHEN, Jun XIA. Investigation on flood event variations at space and time scales in the Huaihe River Basin of China using flood behavior classification[J]. Journal of Geographical Sciences, 2020, 30(12): 2053
Copy Citation Text
Flood is one of the severest natural disasters in the world and has caused enormous causalities and property losses. Previous studies usually focus on flood magnitude and occurrence time at event scale, which are insufficient to contain entire behavior characteristics of flood events. In our study, nine behavior metrics in five categories (e.g., magnitude, duration, timing, rates of changes and variability) are adopted to fully describe a flood event. Regional and interannual variations of representative flood classes are investigated based on behavior similarity classification of numerous events. Contributions of geography, land use, hydrometeorology and human regulation on these variations are explored by rank analysis method. Results show that: five representative classes are identified, namely, conventional events (Class 1, 61.7% of the total), low discharge events with multiple peaks (Class 2, 5.3%), low discharge events with low rates of changes (Class 3, 18.1%), low discharge events with high rates of changes (Class 4, 10.8%) and high discharge events with long durations (Class 5, 4.1%). Classes 1 and 3 are the major flood events and distributed across the whole region. Class 4 is mainly distributed in river sources, while Classes 2 and 5 are in the middle and down streams. Moreover, the flood class is most diverse in normal precipitation years (2006, 2008-2010 and 2015), followed by wet years (2007, 2013-2014), and dry years (2011 and 2012). All the impact factor categories explain 34.0%-84.1% of individual flood class variations. The hydrometeorological category (7.2%-56.9%) is the most important, followed by geographical (1.0%-6.3%), regulation (1.7%-5.1%) and land use (0.9%-2.2%) categories. This study could provide new insights into flood event variations in a comprehensive manner, and provide decision-making basis for flood control and resource utilization at basin scale.
Flood events play positive roles in river geometry formulation, water resource utilization, pollutant migration and transformation, nutrient exchange between floodplain and river channel, integrity of aquatic ecosystem and so on (Milly et al., 2002; Hirabayashi et al., 2013). However, flood events frequently happen at large scales and easily cause severe damage to human life and property. For example, the frequency of global major floods substantially increased during the 20th century, and the annual flood losses increased from 7 billon USD in the 1980s to 24 billon USD in the 2000s (Zbigniew et al., 2013). In China, the flood ranks first among all the natural disasters. The total number of casualties caused by the flood disasters reached 25.9 thousand and direct economic losses were 0.48 trillion USD in the past two decades. Particularly in 2016, an extreme flood happened in 473 rivers across China, and caused 684 deaths and direct economic loss of 52.3 billion USD (Yang et al., 2017). Therefore, it is critical to fully understand the flood event variations across space and time, which could be beneficial for the strategic designing of flood control and resource utilization at basin scale.
Flood event variation shows complicated spatio-temporal heterogeneity due to mutual impacts of rainfall patterns, catchment characteristics and anthropogenic activities (Sauquet and Catalogne, 2011). Numerous time and frequency analysis methods are usually adopted to investigate the variations of flood event metrics at station scale, including temporal trend analysis methods (e.g., Mann-Kendall test, segmented regression model) (Shao and Campbell., 2002; Chen and Li, 2011a; Zhang et al., 2011b; 2012; Wang et al., 2015), change point tests (e.g., Pettit test, Mann-Kendall test, moving t-test) (Zheng et al., 2007; Li et al., 2008; She et al., 2017), periodicity analysis (e.g., wavelet analysis) (Anctil, 2010; Yang et al., 2018) and frequency analysis (e.g., copula analysis, entropy theory) (Zhang et al., 2011a; Singh, 2015). Most of existing studies mainly focus on flood magnitude metrics (e.g., flood volume, peak flood) and their frequencies at station scale (Milly et al., 2002a; Rogger et al., 2012; Xia et al., 2012; Ma et al., 2014; Requena et al., 2017; Merz et al., 2018; Sun et al., 2018). However, all of these findings are still difficult to reveal comprehensive variation characteristics at basin scale. Furthermore, besides these metrics, other flood behavior metrics (e.g., flood timing, rate of change and variability) also play essential roles in the flow events, and have been paid more attention gradually in the last two decades (Richter et al., 1996; Poff et al., 1997; Robinson and Sivapalan, 1997; Merz and Blöschl, 2003; Parajka et al., 2010; Sikorska et al., 2015; Zhang et al., 2015; Zhang et al., 2017). Therefore, it is necessary to analyze the entire behavior characteristics of flood events and their spatio-temporal variations at basin scale by grouping flood events with similar flood behavior characteristics.
Many methods have been adopted for river or catchment classification (Burn and Boorman, 1992; Rosgen, 1994; McDonnell and Woods, 2004; Ali et al., 2012), flow regime classification (Kennard et al., 2010; Zhang et al., 2012), and dam regulation assessment (Mcmanamay et al., 2016; Zhang et al., 2015, 2017). The representative methods include multivariate and principal component analysis (Snelder et al., 2005; Zhang et al., 2012, 2015), artificial neural network (Kumar et al., 2013), and fuzzy decision tree method (Han et al., 2002; Sikorska et al., 2015). The multivariate and principal component analyses are widely used due to their simple, fast and effective classification (Zhang et al., 2012, 2015, 2017). The artificial neural network uses similar input patterns (e.g., Neurons, Layers and Networks) in high-dimensional space to pick out homogeneous samples in low-dimensional spaces. However, it is time-consuming and difficult to get stable classification results because a large number of iterative calculations are required (Liao and Wen, 2007). The fuzzy decision tree method adopts fuzzy approaches to solve classification uncertainties and randomness, but needs to set initial classification standards and types which are based on strong practical experience of users (Sikorska et al., 2015; Brunner et al., 2018).
The Huaihe River Basin is the most densely inhabited basin and the main cropping area of China (Zhang et al., 2012). However, due to complicated climatic and topographical features, this basin is experiencing severe flood disasters, which seriously threaten the safety of human lives and properties (Ning et al., 2003; Zhang et al., 2017). In this study, regional and interannual variations of representative flood event classes are explored based on the behavior similarity classification of numerous events. There are 342 flood events from 2006 to 2015 at 39 stations across the upper and middle Huaihe River Basin which are selected for our study. The specific objectives are to: (1) identify the representative flood event classes based on multiple behavior metrics of magnitude, duration, timing, rate of changes and variability by principal component analysis and cluster analysis; (2) investigate the regional and interannual variations of the representative classes individually; (3) assess potential impacts of geographical, land use, hydrometeorological and human regulation factor categories on the class variations by the rank analysis method. This study is expected to provide new insights into flood event variations in a comprehensive manner, and to provide decision-making basis for flood control and resource utilization at basin scale.
2 Materials and methods
2.1 Study area
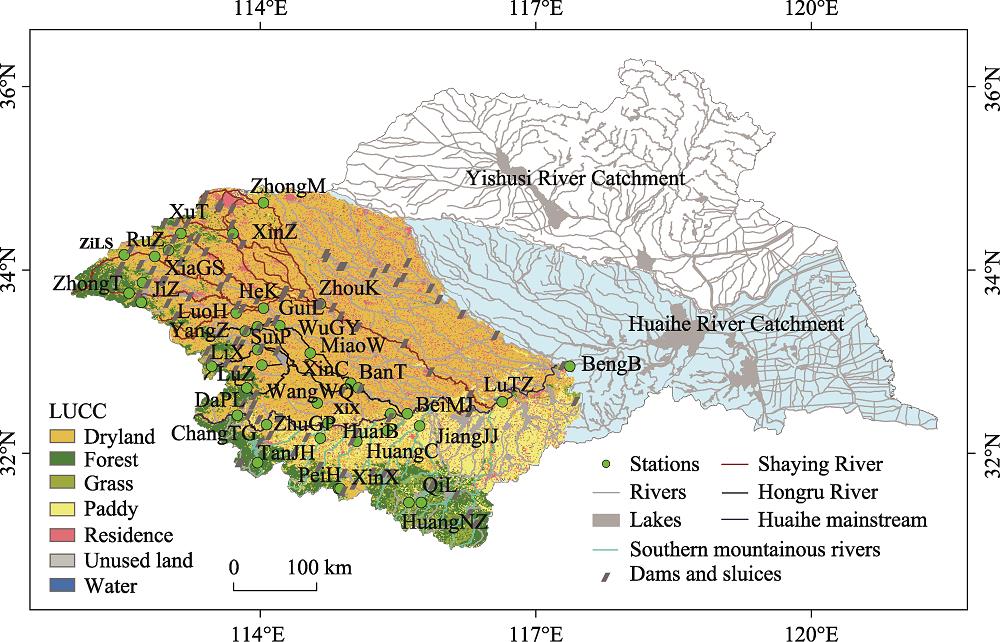
As one of the major basins in China, the Huaihe River Basin (111°55°-121°25°E, 30°55°- 36°36°N) is located between the Yangtze River and Yellow River basins. The drainage area is approximately 2.7×10⁵ km2 which is divided into the Huaihe River Catchment (1.8×10⁵ km2) and Yishusi River Catchment (9.0×10⁴ km2) by the paleo-channel of the Yellow River (Old Yellow River) (Zhang et al., 2012) (Figure 1). It is in the south-north climate transitional straps with warm temperate zone in the north of the basin, and north tropical zone in the east of the basin. The annual average temperature is 13.2‒15.7℃, and the annual average precipitation is 883 mm, of which 50%-75% falls during the flood season (June- September).
Figure 1.
Locations of the Huaihe River Basin, selected hydrological stations, dams and sluices
Due to strong precipitation seasonality, rapid discharge from the upper mountainous areas and backwater effect from downstream lakes, the Huaihe River Basin is one of the most frequently and severely threatened basins by flood disasters. Over 350 major floods have happened in the last 2000 years. Particularly, 29 counties were severely stricken in the upper and middle catchment of the Huaihe River during the catastrophic flood of August, 1975 (“75.8” catastrophic flood). The death roll was 26 thousand and the direct economic loss was billions of USD. Since the beginning of the 21st century, major floods happened continuously across the whole basin, e.g., 2001, 2003, 2007, 2009, 2011 and 2020. In order to regulate floods, 9643 reservoirs and 23,767 sluices had been constructed with the storage capacities accounting for over half of the annual runoff magnitude in the Huaihe River Basin by the end of 2018. Therefore, the flow regimes of the Huaihe mainstream and most of the tributaries were regulated remarkably (Zhang et al., 2015). In this study, the upper and middle catchments of the Huaihe River (i.e., catchment controlled by the Bengbu station) are selected as the study area, including Shaying River, Hongru River, southern mountainous rivers and Huaihe mainstream.
2.2 Data sources
The hourly flow observations of 342 flood events at 39 hydrological stations in the three main tributaries (i.e., Shaying River, Hongru River and Southern mountainous rivers) and the Huaihe mainstream are collected from the hydrological yearbooks of Henan and Anhui provinces from 2006 to 2015. There are 89 flood events at 11 stations in the Shaying River, 76 events at 11 stations in the Hongru River, 105 events at nine stations in the Southern mountainous rivers, and 72 events at eight stations in the Huaihe mainstream. The general geographical, major land use and climatic characteristics of controlled catchments are presented in Table 1.
ID
Rivers
Stations
Dam regulation
Catchment area (km2)
Slope length (km)
Slope (%)
Elevation (m)
River density (km/km2)
Major land use (%)
Flood events
Precipitation (mm)
Potential evapotranspiration (mm)
1
Shaying River
ZiLS
/
1800
89.4
22.15
818.3
0.027
Forest (67.6)
12
80.0±76.3
36.9±18.0
2
ZhongT
/
485
41.4
29.07
680.2
0.019
Forest (77.5)
13
71.0±55.2
26.7±13.8
3
XiaGS
Yes
354
36.9
19.67
471.0
0.083
Forest (45.0)
10
54.4±36.9
32.2±21.5
4
RuZ
Yes
3005
73.4
16.54
662.2
0.016
Forest (45.8)
11
54.0±27.1
42.8±19.3
5
GaoC
Yes
627
49.1
13.98
493.8
0.055
Dryland (58.4)
5
57.2±68.1
42.5±32.3
6
ZhongM
/
2106
132.3
1.28
144.3
0.027
Dryland (53.4)
5
65.9±51.8
34.7±8.3
7
JiZ
/
46
10.5
16.16
394.0
0.023
Forest (73.9)
5
54.4±87.7
18.7±9.8
8
XinZ
Yes
1079
75.5
5.37
268.4
0.027
Dryland (63.6)
10
134.1±80.6
65.7±68.1
9
HeK
Yes
2124
116.4
3.32
153.1
0.004
Dryland (72.4)
9
57.2±35.4
38.0±14.8
10
LuoH
Yes
12,150
170.0
7.75
316.5
0.002
Dryland (59.7)
6
45.3±34.3
44.9±12.0
11
ZhouK
Yes
25,800
202.1
4.47
214.9
0.001
Dryland (67.5)
3
54.1±52.6
44.6±41.8
12
Hongru River
XuT
/
70
13.9
22.67
554.1
0.430
Dryland (61.4)
3
64.1±57.6
26.9±18.7
13
SuiP
Yes
1760
96.4
5.08
164.9
0.030
Dryland (59.4)
9
67.5±37.1
23.0±28.4
14
YangZ
Yes
1037
61.5
4.23
141.9
0.122
Dryland (65.4)
5
12.8±14.0
26.0±14.8
15
WuGy
Yes
1564
107.8
2.37
105.9
0.054
Dryland (73.2)
8
38.3±46.2
36.7±17.0
16
LiX
/
78
18.0
6.50
175.5
0.095
Dryland (38.0)
10
39.8±32.9
24.6±26.3
17
ZhuMD
/
104
17.8
2.74
105.3
0.113
Dryland (75.0)
3
37.5±31.1
10.2±4.1
18
MiaoW
Yes
2660
95.2
1.39
81.4
0.026
Dryland (77.8)
12
43.4±52.4
47.6±16.8
19
LuZ
/
396
38.4
9.50
214.7
0.031
Forest (56.5)
14
24.7±29.3
18.4±9.9
ID
Rivers
Stations
Dam regulation
Catchment area (km2)
Slope length (km)
Slope (%)
Elevation (m)
River density (km/km2)
Major land use (%)
Flood events
Precipitation (mm)
Potential evapotranspiration (mm)
20
XinC
Yes
4110
178.5
0.86
66.2
0.043
Dryland (79.8)
2
71.1±10.6
60.7±1.6
21
BanT
Yes
11,280
197.6
1.69
88.5
0.008
Dryland (74.2)
4
18.6±26.1
34.9±28.8
22
GuiL
Yes
1050
57.6
3.76
133.3
0.108
Dryland (67.0)
6
31.1±38.1
31.5±10.4
23
Southern mountainous rivers
TanJH
/
152
24.3
20.33
279.9
0.040
Forest (88.2)
12
81.2±54.9
25.7±12.7
24
ZhuGP
Yes
1639
94.2
7.11
159.8
0.036
Forest (43.6)
14
75.6±66.0
51.4±19.9
25
XinX
Yes
274
31.5
19.40
286.1
0.071
Dryland (57.7)
16
79.2±54.1
42.8±32.2
26
HuangNZ
/
805
48.9
24.03
487.4
0.006
Forest (46.5)
10
25.1±34.5
24.5±9.6
27
QiL
/
185
31.4
26.65
531.5
0.006
Forest (58.3)
14
29.6±31.2
15.6±6.6
28
HuangC
Yes
2050
117.9
6.76
156.7
0.036
Dryland (47.7)
6
52.2±30.1
84.6±38.7
29
BeiMJ
/
1710
111.6
2.88
101.9
0.037
Paddy (47.7)
16
73.4±37.7
56.1±17.2
30
JiangJJ
Yes
5930
161.2
11.99
246.6
0.008
Forest (36.5)
8
54.5±34.3
61.8±30.6
31
PeiH
Yes
18
8.6
30.98
390.3
0.167
Forest (100.0)
9
87.9±54.2
22.6±12.4
32
Huaihe mainstream
DaPL
Yes
1640
70.0
6.68
218.2
0.111
Forest (45.9)
13
58.1±36.6
44.9±21.5
33
ChangTG
Yes
3090
78.0
5.51
185.5
0.031
Dryland (41.1)
14
79.6±45.9
53.4±22.9
34
XiX
Yes
10,190
124.7
4.86
148.2
0.008
Dryland (36.2)
10
84.5±46.0
75.8±24.5
35
HuaiB
Yes
16,005
138.7
3.93
125.0
0.005
Dryland (43.2)
10
60.2±43.1
96.1±46.4
36
LuTZ
Yes
88,630
232.3
4.14
147.7
0.001
Dryland (54.3)
5
73.6±70.8
73.7±46.4
37
BengB
Yes
121,330
279.3
3.23
123.6
0.001
Dryland (57.2)
4
46.53±39.7
47.7±31.4
38
WangWQ
Yes
200
33.2
0.91
63.3
0.131
Dryland (91.4)
12
28.8±27.5
24.3±11.9
39
WangJB
Yes
30,630
159.8
2.77
104.5
0.003
Dryland (56.6)
4
107.1±59.1
113.6±22.4
Table 1.
The general characteristics of controlled catchments, and the selected flood events
2.3 Flood behavior metrics and potential impact factors
Nine flood behavior metrics in five categories of magnitude, duration, timing, rate of changes and variability are adopted to describe the overall characteristics of flood events. The detailed definitions and calculations are given in Table 2.
Our study investigates the potential impacts of geographical, land use, hydrometeorological and regulation categories on the flood event classes (Zhang et al., 2010; Xia et al., 2012b; Shi et al., 2013; Zhang et al., 2015; Nied et al., 2017). In this study, 40 geographical, land use, hydrometeorological and human regulation factors are adopted to investigate potential impacts on the individual flood event classes at catchment scale (Table 3). The geographical factors (n=10) include location (longitude and latitude: Long and Latt), catchment area (Cat_A, km2), average elevation (Cat_ae, m), slope (Cat_slp, %) and length (Cat_len, km) of the controlled catchment, river slope (Rch_slp, %) and length (Rch_len, km), river width-depth ratio (Rch_wdr, m/m), and river density (Rch_den, km/km2). The land use factors (n=7) are the main land use areas in the controlled catchment, i.e., paddy (Lu_pad, km2), dryland (Lu_dry, km2), forest (Lu_fst, km2), grass (Lu_grs, km2), water (Lu_wat, km2), urban (Lu_urb, km2) and unused land (Lu_uns, km2). The hydrometeorological factors (n=13) mainly involve the cumulative amounts of precipitation and potential evapotranspiration during the flood event (Pcp_tot and Pet_tot, mm) and in the antecedent days, the annual amounts (Pcp_ann and Pet_ann, mm) and the ratios in flood season (R_fldpcp and R_fldpet), and baseflow index of the flood event (BFI) gained by averaging the BFI results of Chapman-Maxwell method (Chapman, 1999), Boughton-Chapman method (Boughton, 1993) and Lyne-Hollick method (Lyne and Hollick, 1979). The antecedent three, five and seven days are usually adopted for the hydrological simulation and flood disaster assessments (Liu et al., 2006; Ma et al., 2012), and thus are adopted in this study (i.e., Pcp_3d, Pcp_5d, Pcp_7d, Pet_3d, Pet_5d and Pet_7d,mm). Due to the difficulties to collect hourly precipitation and potential evapotranspiration observations, the Pcp_tot and Pet_tot are calculated at the daily scale, i.e., from the beginning day to the end day of flood event. The dam regulation factors (n=10) include number of dams and sluices (num_rsv), total and beneficial storage capacities of dams and sluices (tot_rsv and use_rsv, 108 m3), and their ratios of annual average runoff magnitude from 2006 to 2015 (R_totrsv and R_usersv), number of water diversion projects (num_wdp) and total capacities (tot_wdp, 108 m3), number of water pumping projects (num_wpp) and total capacities (tot_wpp, 108 m3), and total capacity of water transferring projects (tot_wtp, 108 m3). All the factor values are obtained for all the station-controlled catchments.
Factor categories
Factors
Flood event implications
Geography
Location
Longitude and latitude (Long and Latt)
All the behavior categories
Catchment
Area (Cat_A, km2), average elevation (Cat_ae, m), slope (Cat_slp, %) and length (Cat_len, km)
Magnitude, rate of changes and forms
River
Slope (Rch_slp, %) and length (Rch_len, km), with-depth ratio (Rch_wdr, m/m), river density (Rch_den, km/km2)
Magnitude, rate of changes and forms
Land use
Land use area
Paddy (Lu_pad, km2), dryland (Lu_dry, km2), forest (Lu_fst, km2), grass (Lu_grs, km2), water (Lu_wat, km2), urban (Lu_urb, km2) and unused land (Lu_uns, km2)
Magnitude, rate of changes and forms
Hydrometeoro- logy
Precipitation
Cumulative amount in the antecedent three, five and seven days (Pcp_3d, Pcp_5d, Pcp_7d, mm) and during the flood event (Pcp_tot, mm), annual amount (Pcp_ann, mm) and ratio of flood season (R_fldpcp)
All the behavior categories
Potential evapotranspiration
Cumulative amount in the antecedent three, five and seven days (Pet_3d, Pet_5d and Pet_7d, mm) and during the flood event (Pet_tot, mm), annual amount (Pet_ann, mm) and ratio of flood season (R_fldpet)
Magnitude
Baseflow
Baseflow index (BFI)
Magnitude, duration and forms
Human regulation
Water storage project
Number (Num_rsv), total and beneficial capacities (Tot_rsv and Use_rsv, 108 m3), and their ratios of annual average runoff magnitude (R_totrsv and R_usersv)
All the behavior categories
Water diversion project
Number (Num_wdp) and total capacities (Tot_wdp, 108 m3)
Magnitude
Water pumping project
Number (Num_wpp) and total capacities (Tot_wpp, 108 m3
Magnitude
Water transferring project
Total capacity (Tot_wtp, 108 m3)
Magnitude
Table 3.
Potential impact factor categories used to analyze the space and time variations of flood events
The data sources of Geographic Information System (GIS), gauged hydrometeorological observations, and dam regulations are collected for the impact assessments. The GIS data sources include the Digital Elevation Model (DEM) (100 m×100 m resolution), and land use data in 2005, 2010 and 2015 (1000 m×1000 m resolution), all of which are from the Data Center for Resource and Environmental Sciences, Chinese Academy of Sciences (http://www.resdc.cn/). The geographical and land use factors of station-controlled catchments are extracted based on DEM and land use data using the hydrological toolset of ArcGIS platform (Environmental Systems Research Institute, 2011). The hydrometeorological observations include the daily precipitation and temperature observations at 80 stations collected from the China meteorological administration (http://cdc.cma.gov.cn/home.do). The gauged potential evapotranspiration is calculated using the Hargreaves method (Hargreaves and Samani, 1982), and both the precipitation and potential evapotranspiration factors in the catchments are calculated from the gauged observations using the inverse distance weighting interpolation method. The dam regulation data sources are collected from the Huaihe River Basin Hydrology Handbook (Ning et al., 2003).
2.4 Methods
Both the principal component analysis and the cluster analysis are adopted to identify the main flood event classes and their variations. The principal component analysis has advantages of merging multiple correlated metrics into independent composite components without losing the metric information (Zhang et al., 2017). The cluster analysis is beneficial to identify representative characteristics from multiple pieces of chaotic information (Olden et al., 2012). Currently, both principal component analysis and cluster analysis are widely applied in the hydrology community, such as river classification (Mcmanamay et al., 2016), assessment of flow regime variation at spatio-temporal scales (Zhang et al., 2015, 2017) and flood classification (Sikorska et al., 2015).
2.4.1 Principal component analysis
The nine flood behavior metrics of all the 342 events could be formed as a metric matrix A:
where aij is the ith flood behavior metric (i = 1, 2, …, m; m= 9) for the jth flood event (j = 1, 2, …, n; n = 342), i.e., Rsum,j (mm), Qpk,j (none), Tduration,j (day), Fbegin,j (day), Tpk,j (none), RQrise,j (1/hr), RQdown,j (1/hr), Npk,j (none) and CVj (none); Aj is the vector of flood behavior metrics for the jth flood event; and n is the total flood event number. The standardization is usually implemented as follows for all the flood behavior metrics to eliminate impacts of different units.
$\left\{ \right.
$
where aij* is the ith flood behavior metric after the standardization; ${{\bar{a}}_{i}}$ and ${{\sigma }_{i}}$ are the average value and standard deviation of ith flood behavior metric; Aj* is the vector of flood behavior metrics for the jth flood event after the standardization.
Due to the high dimensionality and correlation among different flood behavior metrics, the principal component analysis is adopted to simplify the matrix A into a new matrix P with several independent principal components (i.e., PCAs). The kth PCA (k = 1, 2, …, l; l<m) is calculated as follows:
where pki is the factor loading of kth principal component (k = 1, 2, …, l; i= 1, 2, …, m). The factor loadings are the eigenvectors of correlation matrix R of flood behavior metrics.
where rij is the correlation coefficient between the ith and jth metrics. The eigenequation of correlation matrix is formulated as follows:
$\left| \lambda \cdot I-R \right|=0
$
where λi is the ith eigenvalue (i= 1, 2, …, m) and its corresponding eigenvector is pi in equation (2), all of which are gained by the Jacobian method (Simon and Blume, 1994). Variance is adopted to assess information of the flood behavior metrics contained in the PCA. The larger the variance of this PCA, the more metric information it contains. Contribution (Ri) of the ith PCA is calculated as follows:
If the cumulative variance reaches a certain threshold, the first l PCAs are considered to contain enough information of the flood behavior metrics. In this study, the threshold is set as 80%.
2.4.2 Cluster analysis
The hierarchical clustering analysis is adopted to cluster 342 flood events into some representative flood event classes based on the PCA similarity among different flood events. Euclidean distance is used to calculate the PCA similarity and the equation is as follows:
where l is the total PCA number, and i, j are the ith and jth flood events. Ward’s method is used for hierarchical clustering of all the flood events. The Goodman-Kruskal index (GKI), C index (CI), and minimum cluster size are used to evaluate the clustering performance. The final clustering result is determined according to the greatest value of GKI and the lowest value of CI, and the minimum cluster size is more than two flood events to ensure its representativeness (Zhang et al., 2015).
2.4.3 Impact factor identification of individual flood event classes
The rank analysis method is adopted to detect the potential relationships between impact factor categories and flood event classes. The typical methods are the Detrended Correspondence Analysis (DCA), Redundancy Analysis (RDA) and Canonical Correlation Analysis (CCA) (Zhang et al., 2016). The RDA is a linear model, and the CCA is an unimodal model, both of which could be used for the detection. The data sources of impact factor categories and flood event metrics in the individual classes are firstly detected by the DCA method. All the 40 potential impact factors of all the 342 events could be formed as a factor matrix F:
where Fij is the ith impact factors (i = 1, 2, …, k; k= 40) for the jth flood event (j = 1, 2, …, n; n = 342); Fj is the vector of flood behavior metrics for the jth flood event, which is standardized using Equation (2). Each factor is assigned a score (xi). Scores for each event (yj) are calculated as a weighted average as follows:
This procedure for calculating impact factor and event scores (i.e., Equations 9-11) is repeated until the scores stabilize. The yj scores are referred as a trial vector and deemed to be an eigenvector. The first axis is calculated following the procedure outlined above. The selection of CCA or DCA is according to the length of first axis. If the length is greater than 4.0, CCA is selected. If the length is between 3.0 and 4.0, both CCA and RDA are suitable. If the length is less than 3.0, RDA is selected. The detections are implemented for the entire flood events and the individual flood event classes to identify the main impact factor categories and their contributions on the flood event variations.
3 Results and discussion
3.1 Flood event classification
Five independent PCAs are selected, which explain 83.18% of the entire variance of flood behavior metrics. The first PCA including the characteristic metrics (Qpk, RQrise, RQdown and CV) explains 35.15% of the entire variance. The second PCA including the characteristic metrics (Rsum and Tpk) explains 15.03%. Npk, Fbegin and Tduration represent the third, fourth and fifth PCAs, which explain 11.68%, 11.13% and 10.19%, respectively.
The flood events are classified into several clusters (i.e., two to six) based on the similarity of the PCAs (Figures 2 and 3). As the cluster number increases, the GKI increases gradually from 0.56 to 0.82, and both the CI and minimum size of all the clusters decrease gradually from 0.27 to 0.06 for CI, and from 132 to 14 for the minimum size. Therefore, the performance for the main five clusters is the best with the greatest of GKI (0.82) and the smallest of CI value (0.06). The main five classes are classified for all the flood events in our study.
Figure 2.
Hierarchical clustering results presented by black, red, yellow, blue and green colors for all the flood events named by station name+ event sequence which is sorted in chronological order (e.g., ZiLS01 means the first event at ZiL station)
3.2 Flood behavior characteristics of individual classes
There are 210 flood events in Class 1, accounting for 61.4% of the total number (Figure 4). Most of the events have one peak flood and mainly occur in the flood season. For the flood magnitude, Rsum values are relatively small, and are from 0.07 mm to 48.77 mm with the average of 3.36 mm (Figure 5). The Qpk values are from 3.93 m3/s to 3140 m3/s, accounting for 0.5%-11.3% of the total flood magnitude with the average of 3.17%. For the flood variability, the CV values are from 0.33 to 2.59 with the average of 1.25. For the flood duration and timing, the Tduration values are from 1.83 days to 54.33 days with the average of 10.94 days. The Fbegin values are from 167th to 309th with the average of 220th. Furthermore, the Tpk values are from 0.125 days to 10.70 days after the flood events begin, accounting for 0.9%-62.5% of the total flood durations. For the rates of changes, both the RQrise and RQdown are the second greatest in all the classes with the average of 2.1×10‒3 hr‒1 and 2.7×10‒4 hr‒1, respectively. According to all the flood behavior metrics, the flood events in Class 1 represent the Low discharge, Medium Variable and Single Peak flood events with Medium Rates of changes in the flood season (Class 1: LMV-SP-MR in the flood season).
Figure 4.
Normalized flood hydrographs of individual flood event classes (a-e) and their frequencies of flood events in the pre-flood, flood and post-flood seasons
Variations of individual flood behavior metrics among different classes. Median values are defined by the solid dot symbols, respectively. Each black box illustrates the 25th and 75th percentile values, and the vertical line defines the minimum and maximum values without outliers. The white dot means the 50th percentile value and the violin shape means the frequency distribution of flood behavior metric.
There are 19 flood events in Class 2, accounting for 5.6% of the total number. For the flood magnitude, Rsum values are also quite small, and are from 0.13 mm to 25.03 mm with the average of 5.09 mm (Figure 5). The Qpk values are from 33.6 m3/s to 3220 m3/s, accounting for 0.6%-8.2% of the total flood magnitude with the average of 2.03%. For the flood variability, the CV values are from 0.68 to 2.02 with the average of 1.17. For the flood duration and timing, the Tduration values are from 5.04 days to 28 days with the average of 13.89 days. The Fbegin values are from 175th to 249th with the average of 210th, and all of these events occur in the flood season. Furthermore, there are multiple peak floods in most of flood events in this class, and the Tpk values of the maximum peak flood are from 0.25 day to 3.96 days after the flood events begin, accounting for 5.0%-28.9% of the total flood durations. For the rates of changes, both the RQrise and RQdown are the medium in all the classes with the average of 1.1×10‒3 hr‒1 and 1.1×10‒4 hr‒1, respectively. Therefore, the flood events in Class 2 represent the Low discharge, Medium Variable, Multiple Peak floods with Medium Duration in the flood season (Class 2: LMV-MP-MD in the flood season).
There are 62 flood events in Class 3, accounting for 18.1% of the total number. For the flood magnitude, Rsum values are also small, and are from 0.05 mm to 36.20 mm with the average of 2.79 mm. The Qpk values are from 6.65 m3/s to 2980 m3/s, accounting for 0.5%-10.0% of the total flood magnitude. For the flood variability, the CV values are from 0.57 to 2.78 with the average of 1.30. For the flood duration and timing, the Tduration values are from 3.20 days to 29 days with the average of 11.4 days. The Fbegin values are from 9th to 167th with the average of 109th, and these flood events mainly occur in the pre-flood season. Furthermore, the Tpk values are from 0.125 days to 7.75 days after the flood events begin, accounting for 0.7%-38.2% of the total flood durations with the average of 16.9%. For the rates of changes, both the RQrise and RQdown are the medium in all the classes with the average of 1.7×10‒3 hr‒1 and 1.9×10‒4 hr‒1, respectively. Therefore, the flood events in Class 3 represent the Low discharge, Medium Variable, Single Peak floods with Low Rates of changes in the pre-flood season (Class 3: LMV-SP-LR in the pre-flood season).
There are 37 flood events in Class 4, accounting for 10.8% of the total number. For the flood magnitude, Rsum values are the smallest, and are from 0.05 mm to 7.23 mm with the average of 1.52 mm. The Qpk values are from 31.3 m3/s to 3370 m3/s, accounting for 8.6%-40.7% of the total flood magnitude with the average of 15.5%. These ratios are the greatest among all the classes. For the flood variability, the CV values are the greatest among all the classes, from 1.33 to 3.47 with the average of 2.25. For the flood duration and timing, the Tduration values are from 1 day to 19.38 days with the average of 4.51 days. The Fbegin values are from 122th to 271th with the average of 194th, and these flood events mainly occur in the flood season. Furthermore, the Tpk values are from 0.04 day to 1.21 days after the flood events begin, accounting for 0.2%-37.9% of the total flood durations. For the rates of changes, both the RQrise and RQdown are also the greatest among all the classes with the average of 2.5×10‒2 hr‒1 and 2.4×10‒3 hr‒1, respectively. Therefore, the flood events in Class 4 represent the Low discharge, Extreme Variable, Single Peak floods with High Rates of changes in the flood season (Class 4: LEV-SP-HR in the flood season). This class belongs to the sharp and skinny flood event in the mountainous regions reported by Zhang et al. (2020), and is basically similar with the low discharge and variable flow regimes (Zhang et al., 2012).
There are 14 flood events in Class 5, accounting for 4.1% of the total number. For the flood magnitude, Rsum values are the greatest, and are from 0.5 mm to 266.5 mm with the average of 86.69 mm. Although the Qpk values (from 479 m3/s to 4010 m3/s) are the largest among all the classes, the ratios to the total flood magnitude are the least, only 0.3%-14.1% with the average of 1.68%. For the flood variability, the CV values are the least, and are from 0.08 to 1.28 with the average of 0.55. For the flood duration and timing, the Tduration values are from 3.17 days to 29.5 days with the average of 15.64 days. The Fbegin values were from 61th to 260th with the average of 168th, and these flood events also mainly occur in the flood season. Furthermore, the Tpk values are from 0.3 day to 14.5 days after the flood events begin, accounting for 0.1%-64.0% of the total flood durations. For the rates of changes, both the RQrise and RQdown are the medium in all the classes with the average of 1.5×10‒3 hr‒1 and 1.7×10‒4 hr‒1, respectively. Therefore, the flood events in Class 5 represent the High discharge, Stable, Single Peak floods with Long Duration in the flood season (Class 5: HS-SP-LD in the flood season). This class belongs to the dumpy flood event in the middle and downstream regions reported by Zhang et al. (2020), and is also similar with the high discharge and stable flow regimes (Zhang et al., 2012).
3.3 Regional variations of individual classes
All the flood event classes exist in the Hongru River, Shaying River and Southern mountainous rivers, except the Huaihe mainstream (Figure 6). Class 1 is the dominant flood event at all the attributes across the basin. In particular, over 80% of the flood events at ZhongM and ZiLS stations in the Shaying River, SuiP and MiaoW stations in the Hongru River, HuangNZ station in the Southern mountainous rivers, and WangWQ station in the Huaihe mainstream are in Class 1. Class 2 is mainly distributed in the Hongru River and the downstream of Southern mountainous rivers. Regional distributions of Class 3 are mainly consistent with those of Class 1. Class 4 is mainly distributed in the source areas of Shaying River, Hongru River and Southern mountainous rivers. Class 5 is mainly distributed in the middle and downstream of the Huaihe mainstream. Furthermore, the class diversity of flood events reduces gradually from the source stations to the downstream stations.
Figure 6.
Spatial variations of different flood event classes
In the Shaying River, 78.9% of the flood events belongs to Class 1, followed by Class 3 (18.4%), Class 4 (11.8%), Class 2 (6.5%) and Class 5 (1.3%). All the flood event classes (Classes 1-5) exist at XiaGS station, while only one flood event class (Class 1) exists at ZhongM station. In the Hongru River, 60.5% of the flood events also belong to Class 1, followed by Class 4 (21.1%), Class 3 (11.8%), Class 2 (5.3%) and Class 5 (1.3%). The flood event class is most diverse at GuiL station (Classes 1, 3, 5), LiX station (Classes 1, 2, 4), MiaoW and WuGY stations (Classes 1, 3, 4), while only one flood event class is at SuiP station (Class 1) and ZhuMD station (Class 4). In the Southern mountainous rivers, 78.9% of the flood events belong to Class 1, followed by Class 3 (36.8%), Class 4 (15.8%), Class 2 (5.3%) and Class 5 (1.3%). The flood event class is most diverse at JiangJJ station (Classes 1-3, 5) and XinX station (Classes 1-4), while only one flood event class is at HuangNZ station (Class 1). In the Huaihe mainstream, 57.9% of the flood events belong to Class 1, followed by Classes 3 and 5 (14.5%), and Class 2 (7.9%). No flood events exist in Class 4. The flood event class is most diverse at Xix station (four classes, i.e., Classes 1-4), while only one flood event class is at Lutz and Bengb stations (Class 5).
3.4 Interannual variations of individual classes
For all the flood events, the class is most diverse in the normal precipitation years (2006, 2008-2010 and 2015) including all the five classes (Figure 7), followed by those in the wet years (2007, 2013-2014) with four classes. The classes are most homogeneous in the dry years, i.e., 2011 (Classes 1, 2 and 4) and 2012 (Classes 1, 3 and 4). Class 1 is also dominant in the whole period, except 2010 and 2015. The ratio of Class 1 for the individual years ranges from 38.9% (2015) to 84% (2012) with the average of 62.5%. Classes 2-4 mainly exist in most years of the whole period, except 2007 and 2011 for Class 2, and 2011 for Class 3. The ratios range from 2.7% to 13.3% with the average of 7.1% for Class 2, from 4.0% to 38.9% with the average of 18.5% for Class 3, and from 2.6% to 19.4% with the average of 11.2% for Class 4. Class 5 is only in 2006-2010 and 2015, and the ratio ranges from 2.8% to 13.3% with the average of 6.5%.
Figure 7.
Interannual distributions of flood event classes from 2006 to 2015 in the Shaying River, Hongru River, Southern mountainous rivers, Huaihe mainstream and for all the flood events
The flood event classes in the Shaying River shift from Class 1 to Classes 3 and 4 with the decrease of annual precipitation. Class 1 distributes in the whole period, and is dominant particularly in the dry years (2011, 2012 and 2014). There are only five events in Class 2, mainly in the normal precipitation years (2006, 2008 and 2010); 14 events in Class 3, mainly in the normal precipitation and wet years (2007, 2008, 2010, 2013 and 2015); nine events in Class 4, mainly in the wet years (2009, 2013 and 2015).
The flood event classes in the Hongru River and Southern mountainous rivers are relatively diverse, and there are two or three classes in all the years. In the Hongru River, besides the dominant Class 1, Class 4 exists in most years (except 2013) with the ratios from 11.1% to 40.0%. Only four events exist in Class 2, mainly in the normal precipitation years (2006, 2010 and 2015); nine events in Class 3, mainly in the normal precipitation years (2008, 2009, 2012, 2013 and 2015), and only one event in Class 5 (at XiaGS station in 2007). In the South mountainous rivers, Class 3 exists in most years except in 2011 and 2012 with the ratios from 16.7% to 60.0%. Only four events exist in Class 2, in the dry years (2009, 2011 and 2013); 12 events in Class 4, mainly in the normal precipitation and wet years (2008, 2010-2013); only one event in Class 5 (at JiangJJ station in 2015).
In the Huaihe mainstream, the flood event classes vary most obviously in the whole period. There are four classes (except Class 4) in the wet year (2008), but only one class (Class 1) in the normal precipitation and dry years (2012 and 2013). Class 1 is dominant in 2009, 2011 and 2012 with the ratios being over 85%. Class 5 is mainly distributed in 2006-2010 and 2015 with the ratios from 11.1% to 50.0%, and Classes 2 and 3 are mainly distributed in 2013-2015 with the ratios from 6.7% to 50.0% for Class 2, and from 11.1% to 40.0% for Class 3, respectively.
3.5 Potential impacts on the flood event classes
According to the DCA detection, all the lengths of first axises are less than 3.0. Thus, the RDA method is selected. By the RDA analysis, 80% of the impact factors (32/40) are detected to be significantly correlated with the flood event variations (p≤0.01) (Figure 8). The significant factors are the position (Long), Cat_ae, Cat_A, Cat_slp, Cat_len, Rch_slp and Rch_wdr in the geographical category with the correlation coefficients (r) ranging from 0.18 to 0.80, are the Lu_pad, Lu_dry, Lu_fst, Lu_grs, Lu_wat, Lu_urb and Lu_uns in the land use category (r: 0.64-0.82), are the BFI, Pcp_tot, Pet_tot, Pet_7d, R_fldpcp and R_fldpet in the hydrometeorological category (r: 0.18-0.32), and are the num_rsv, tot_rsv, use_rsv, num_wdp, tot_wdp, num_wpp, tot_wpp, and tot_wtp in the regulation category (r: 0.69-0.82). There are 34.0% of the total flood event variations explained by all the impact factor categories, i.e., 15.3%, 2.1%, 1.0% and 0.9% of the total variations by hydrometeorology, regulation, geography and land use, respectively. The rest 14.7% variations are the combined impacts of all the categories.
Figure 8.
Correlation coefficients between impact factors and flood behavior metrics (the blank column means insignificant impact factor)
Due to the flood event classification, the impact factor categories explain more variations for the individual flood event classes (Figure 9). In Class 1, 71.2% of the flood event variations are explained including 46.3% by the hydrometeorological category, 1.7% by the regulation category, 1.6% by the geographical category, 1.2% by the land use category, and 20.4% by the combined impacts of all the categories. In Class 3, 82.6% of the flood event variations are explained including 56.9% by the hydrometeorological category, 6.3% by the geographical category, 5.1% by the regulation category, 2.2% by the land use category, and 12.2% by the combined impacts of all the categories. In Class 4, 84.1% of the flood event variations are explained including 52.3% by the hydrometeorological category, 4.0% by the land use category, and 27.8% by the combined impacts of all the categories. In Classes 2 and 5, only the hydrometeorological category is statistically significant, explaining only 7.2% and 47.9% of the flood event variations in Classes 2 and 5, respectively.
Figure 9.
Contributions of impact categories and their combinations on the regional and interannual variations of individual flood event classes
Therefore, the regional and interannual variations of both the individual flood events and classes are mainly impacted by the hydrometeorological category, particularly the total precipitation amount during the events which directly determines all the flood event characteristics (Wang et al., 2015; Nied et al., 2017). The cumulative precipitation and potential evapotranspiration in antecedent days impact initial soil moisture and water storage in river systems, which obviously impact the runoff yield processes (Xia et al., 2005). The baseflow provides stable and perennial flow for river streamflow, which directly impacts the flood magnitude, duration and forms (i.e., Class 5) (Shao and Campbell, 2002; Chapman, 1999). The impacts of geographical, regulation and land use categories also could not be ignored. The locations mainly determine the characteristics of climate, land covers and the catchment and river factors directly alter runoff yield and routing, and thus impact the magnitude, rate of changes and forms of flood events (Kennard et al., 2010; Zhang et al., 2016). The land use category mainly impacts runoff yield and overland routing (Shi et al., 2013; Sikorska et al., 2015; Zhang et al., 2016). For example, Class 1 is the most common flood event types at 89.7% of the stations (35/39) across the basin. The flood event characteristics belong to natural storm floods mainly impacted by the hydrometeorological category. The flood events in Class 4 are mainly in the headstreams without severe regulations of reservoirs and sluices. The main flood event characteristics are high peak flood, short duration and steep changes mainly impacted by the precipitation and retention of land covers (Zhang et al., 2012).
Furthermore, 27 of all the 39 stations (69.2%) are at the downstreams of reservoirs or sluices (Table 1), including 63.6% of stations in the Shaying River, 63.6% in the Hongru River, 55.6% in the Southern mountainous rivers and 87.5% in the Huaihe mainstream. Thus, the flood events at these stations are altered obviously, particularly in the upstreams of the Southern mountainous rivers, Shaying River and Hongru River which are regulated by large reservoirs (Zhang et al., 2012, 2015). Although the impacts of regulation category are not significant (i.e., Classes 2 and 5) by the RDA, the potential impacts also could be deduced. For example, 78.6% of the stations (11/14) in Class 2 are in the upstreams and also mainly regulated by large reservoirs. The main regulation characteristics are to decrease the peak flood magnitude and rate of changes, and to noticeably increase the peak flood numbers and flood durations. These characteristics are quite similar with the regulation of “storage reservoir” (McManamay et al., 2016) and Late Summer Flow regulation (L-V-MI) reported by Zhang et al. (2015). In Class 5, all the stations are in the middle and lower reaches of the Huaihe mainstream. The main characteristics are large flood volume, stable and long duration due to the flood confluence from all the tributaries. Thus, all the flood events could be hydrological responses to combined impacts of hydrometeorology, geography, land use and dam regulation in the upstream regions (Zhang et al., 2015). In Class 3, 75.0% of the stations (21/28) are in the downstream regulated by the sluices (Zhang et al., 2015). The main flood characteristics are very similar with those of Class 1, but the flood event timings are different. Furthermore, the main regulation characteristics by sluices are only to slightly decrease the rates of changes, and are quite similar with the regulation of “run-of-river reservoir” (McManamay et al., 2016).
4 Conclusions
The flood event variations are investigated at both regional and interannual scales based on the flood behavior metrics using the classification approach, and the potential impact categories are further explored to explain the flood event variations using the rank analysis. There are 342 flood events at 39 stations in the upper and middle reaches of the Huaihe River Basin selected for the study. Results show that:
(1) All the flood events are clustered into five flood event classes, i.e., the low discharge, medium variable, single peak flood events with medium rates of changes in the flood season (Class 1), the low discharge, medium variable, multiple peak floods with medium duration in the flood season (Class 2), the low discharge, medium variable, single peak floods with low rates of changes in the pre-flood season (Class 3), the low discharge, extreme variable, single peak floods with high rates of changes in the flood season (Class 4), and the high discharge, stable, single peak floods with long duration in the flood season (Class 5). There are 210, 19, 62, 37 and 14 events in Classes 1-5, respectively, accounting for 61.4%, 5.6%, 18.1%, 10.8% and 4.1% of the total number of events.
(2) The flood event class is most diverse at the source and upstream stations, and becomes single at the downstream stations. Classes 1 and 3 are the major flood events in all the attributes across the basin. Class 2 mainly distributes in the Hongru River and the downstreams of Southern mountainous rivers. Class 4 mainly distributes in the source rivers, and Class 5 mainly distributes in the middle and downstream of Huaihe mainstream. Furthermore, most of the flood event classes exist in the normal precipitation years, followed by the wet years. The flood event class becomes homogeneously distributed in the dry years.
(3) The impacts of geographical, land use, hydrometeorological and regulation categories probably result in the regional and interannual variations for both all the flood events and the individual classes. The contributions of all the impact factor categories range from 34.0% to 84.1%, in which the hydrometeorological category is the most important (7.2%-56.9%). The impacts of geographical, regulation and land use categories should not be ignored, which explain 1.0%-6.3%, 1.7%-5.1% and 0.9%-4.0% of the total variations of flood event classes. Moreover, the combined influences of all the impact factor categories can explain 14.7% of the total flood event variations, 20.4% of the total variations in Class 1, 12.2% in Class 3 and 27.8% in Class 4, respectively.
The results of flood event classes could be beneficial to investigate the flood event variations in a comprehensive manner. For example, the flood event variations in different rivers could be deduced in advance from the identified flood event classes according to the geographical, land use, hydrometeorological and regulation conditions. The variations would be very informative to design plans for flood control and disaster mitigation, water resource utilization at basin scale. However, the potential impacts on the flood event variations can be further explored because 15.9%-92.8% of the total variations in the individual classes are still not explained. Hydrological modelling approach could be adopted to explore the potential impact mechanisms, and quantify their contributions in future studies.
References
[1] AliG, TetzlaffD, SoulsbyC et al. A comparison of similarity indices for catchment classification using across-regional dataset. Advance in Water Resources, 40, 11-22(2012).
[2] AnctilF. Wavelet analysis of the interannual variability in Southern Quebec Streamflow. Journal of Climate, 17, 163-173(2010).
[3] Boughton WC. A hydrograph-based model for estimating the water yield of ungauged catchments, paper presented at Hydrology and Water Resources Symposium. Inst. of Eng. Aust., Newcastle, N.S.W.(1993).
[4] Brunner MI, ViviroliD, FurrerR, SeibertJ et al. Identification of flood reactivity regions via the functional clustering of hydrographs. Water Resources Research, 54, 1852-1867(2018).
[5] Burn DH, Boorman DB. Catchment classification applied to the estimation of hydrological parameters at ungauged catchments (technical report 118). Wallingford, Oxfordshire, UK: Institute of Hydrology(1992).
[6] Chapman TA. Comparison of algorithms for stream flow recession and baseflow separation. Hydrological Processes, 13, 701-714(1999).
[7] HanD, Cluckie ID, KarbassiounD et al. River flow modelling using fuzzy decision trees. Water Resources Management, 16, 431-445(2002).
[8] Hargreaves GH, Samani ZA. Estimating potential evapotranspiration. Journal of the Irrigation & Drainage Division, 108, 225-230(1982).
[9] HirabayashiY, MahendranR, KoiralaS et al. Global flood risk under climate change. Nature Climate Change, 3, 816-821(2013).
[10] Kennard MJ, Pusey BJ, Olden JD et al. Classification of natural flow regimes in Australia to support environmental flow management. Freshwater Biology, 55, 171-193(2010).
[11] Kumar A RS, Goyal MK, Ojha C SP et al. Application of ANN, fuzzy logic and decision tree algorithms for the development of reservoir operating rules. Water Resources Management, 27, 911-925(2013).
[12] Li ZL, Xu ZX, Li JY et al. Shift trend and step changes for runoff time series in the Shiyang River basin, Northwest China. Hydrological Processes, 22, 4639-4646(2008).
[13] Liao SH, Wen CH. Artificial neural networks classification and clustering of methodologies and applications: Literature analysis from 1995 to 2005. Expert Systems with Application, 32, 1-11(2007).
[14] LyneV, HollickM. Stochastic time-variable rainfall-runoff modelling, I.
E. Aust. Natl. Conf. Publ. 79/10, pp.
89-93, Inst. of Eng. Aust., Canberra, ACT(1979).
[15] MaF, YeA, GongW et al. An estimate of human and natural contributions to flood changes of the Huai River. Global & Planetary Change, 119, 39-50(2014).
[16] Ma GB, Jiang WG, LiJ et al. Assessment and validation of short-term flood hazards in China. Geographical Research, 31, 34-44(2012).
[17] McDonnell JJ, WoodsR. On the need for catchment classification. Journal of Hydrology, 299, 2-3(2004).
[18] Mcmanamay RA, Oigbokie CO, Kao SC et al. Classification of US hydropower dams by their modes of operation. River Research and Applications, 32, 1450-1468(2016).
[19] MerzB, Dung NV, ApelH et al. Spatial coherence of flood-rich and flood-poor periods across Germany. Journal of Hydrology, 559, 813-826(2018).
[22] NiedM, Schr?terK, LüdtkeS et al. What are the hydro-meteorological controls on flood characteristics?. Journal of Hydrology, 545, 310-326(2017).
[23] NingY, QianM, WangY. Huaihe River Basin Hydrology Handbook(2003).
[24] Parajka JK, OhnovaS, BalintG et al. Seasonal characteristics of flood regimes across the Alpine-Carpathian range. Journal of Hydrology, 394, 78-89(2010).
[25] Poff NL, Allan JD, Bain MB et al. The natural flow regime: A paradigm for river conservation and restoration. Bioscience, 47, 769-784(1997).
[26] Requena AI, ChebanaF, Ouarda TB. Heterogeneity measures in hydrological frequency analysis: Review and new developments. Hydrology and Earth System Sciences, 21, 1651-1668(2017).
[27] Richter BD, Baumgartner JV, PowellJ et al. A method for assessing hydrologic alteration within ecosystems. Conservation Biology, 10, 1163-1174(1996).
[28] Robinson JS, SivapalanM. Temporal scales and hydrological regimes: Implications for flood frequency scaling. Water Resources Research, 33, 2981-2999(1997).
[29] RoggerM, KohlB, PirklH et al. Runoff models and flood frequency statistics for design flood estimation in Austria - Do they tell a consistent story?. Journal of Hydrology, 456/457, 30-43(2012).
[30] Rosgen DL. A classification of natural rivers. Catena, 22, 169-199(1994).
[31] SauquetE, CatalogneC. Comparison of catchment grouping methods for flow duration curve estimation at ungauged sites in France. Hydrology and Earth System Sciences, 15, 2421-2435(2011).
[32] ShaoQ, CampbellN. Applications: Modelling trends in groundwater levels by segmented regression with constraints. Australian & New Zealand Journal of Statistics, 44, 129-141(2002).
[33] She DX, XiaJ, Shao QX et al. Advanced investigation on the change in the streamflow into the water source of the middle route of China’s water diversion project. Journal of Geophysical Research: Atmospheres, 122, 6950-6951(2017).
[34] ShiP, Ma XX, Hou YB et al. Effects of land-use and climate change on hydrological processes in the upstream of Huai River, China. Water Resources Management, 27, 1263-1278(2013).
[35] Sikorska AE, ViviroliD, SeibertJ. Flood-type classification in mountainous catchments using crisp and fuzzy decision trees. Water Resources Research, 51, 7959-7976(2015).
[36] Singh VP. Entropy, Theory in Hydrologic Science and Engineering. New York, USA:
McGraw-Hill Education(2015).
[37] Snelder TH, Biggs BJ, Woods RA. Improved ecohydrological classification of rivers. River Research and Applications, 21, 609-628(2005).
[38] SunP, Wen QZ, ZhangQ et al. Nonstationarity evaluation of flood frequency and flood risk in the Huai River basin, China. Journal of Hydrology, 567, 393-404(2018).
[39] WangW, WeiJ, ShaoQ et al. Spatial and temporal variations in hydro-climatic variables and runoff in response to climate change in the Luanhe River basin, China. Stochastic Environmental Research and Risk Assessment, 29, 1117-1133(2015).
[40] XiaJ, DuH, ZengS et al. Temporal and spatial variations and statistical models of extreme runoff in Huaihe River Basin during 1956-2010. Journal of Geographical Sciences, 22, 1045-1060(2012).
[41] XiaJ, She DX, Zhang YY et al. Spatial-temporal trend and statistical distribution of extreme precipitation events in Huaihe River Basin during 1960-2009. Journal of Geographical Sciences, 22, 195-208(2012).
[42] YangP, XiaJ, Zhan CS et al. Discrete wavelet transform-based investigation into the variability of standardized precipitation index in Northwest China during 1960-2014. Theoretical and Applied Climatology, 132, 167-180(2018).
[43] Yang WZ, Zhang BW, Fu RM. A summary of flood disaster in 2016. China Flood & Drought Management, 27, 26-29(2017).
[44] Zbigniew WK, ShinjiroK, Sonia IS et al. Flood risk and climate change: Global and regional perspectives. Hydrological Sciences Journal, 59, 1-28(2013).
[45] ZhangQ, Chen YQ, Chen XH et al. Copula-based analysis of hydrological extremes and implications of hydrological behaviors in the Pearl River basin, China. Journal of Hydrologic Engineering, 16, 598-607(2011).
[46] Zhang SJ, Jiang YH, Yang HJ et al. An hydrology-process based method for antecedent effect rainfall determination in debris flow forecasting. Advances in Water Science, 26, 34-43(2015).
[47] Zhang YY, Chen QT. Characteristics of main flood event types and their temporal-spatial variations in the upper and middle reaches of the Huai River Basin. Progress in Geography, 39, 627-635(2020).
[48] Zhang YY, Shao QX, XiaJ. Changes of flow regimes and precipitation in Huai River Basin in the last half century. Hydrological Processes, 25, 246-257(2011).
[49] Zhang YY, Shao QX, Zhao T TG. Comprehensive assessment of dam impacts on flow regimes with consideration of interannual variations. Journal of Hydrology, 552, 447-459(2017).
[50] Zhang YY, XiaJ, Bunn SE et al. Classification of flow regimes for environmental flow assessment in regulated rivers: The Huai River Basin, China. River Research and Applications, 28, 989-1005(2012).
[53] Zheng HX, ZhangL, Liu CM et al. Changes in stream flow regime in headwater catchments of the Yellow River basin since the 1950s. Hydrological Processes, 21, 886-893(2007).
Yongyong ZHANG, Qiutan CHEN, Jun XIA. Investigation on flood event variations at space and time scales in the Huaihe River Basin of China using flood behavior classification[J]. Journal of Geographical Sciences, 2020, 30(12): 2053