• Photonics Research
  • Vol. 11, Issue 9, 1517 (2023)
Jingxuan Chen1、2、†, Mingjin Wang1、3、†, Ting Fu1、2, Yufei Wang1、4、6、*, Xueyou Wang1, Yingqiu Dai1、4, Ziyuan Liao1、2, Haiyang Ji1、2, and Wanhua Zheng1、2、3、4、5、7、*
Author Affiliations
  • 1Laboratory of Solid State Optoelectronics Information Technology, Institute of Semiconductors, Chinese Academy of Sciences, Beijing 100083, China
  • 2Center of Materials Science and Optoelectronics Engineering, University of Chinese Academy of Sciences, Beijing 100049, China
  • 3State Key Laboratory on Integrated Optoelectronics, Institute of Semiconductors, Chinese Academy of Sciences, Beijing 100083, China
  • 4College of Future Technology, University of Chinese Academy of Sciences, Beijing 101408, China
  • 5Weifang Academy of Advanced Opto-Electronic Circuits, Weifang 261021, China
  • 6e-mail: yufeiwang@semi.ac.cn
  • 7e-mail: whzheng@semi.ac.cn
  • show less
    DOI: 10.1364/PRJ.491637 Cite this Article Set citation alerts
    Jingxuan Chen, Mingjin Wang, Ting Fu, Yufei Wang, Xueyou Wang, Yingqiu Dai, Ziyuan Liao, Haiyang Ji, Wanhua Zheng. Improvement on the topological localized interface enabled by chiral symmetry[J]. Photonics Research, 2023, 11(9): 1517 Copy Citation Text show less
    Schematic of the topological semiconductor laser array based on the traditional SSH model with a single defect. The yellow arrow denotes current injection on the single-defect waveguide, and the red part is the active region. The inset presents a sketch of the traditional 1D SSH dimer chain, where the green dashed squares indicate primitive cells in two distinct topological phases. In the topological chain, inter-cell coupling is stronger than intra-cell coupling, while intra-cell coupling is stronger in the trivial chain. A zero-energy topological state emerges at the interface indicated by the black dashed line.
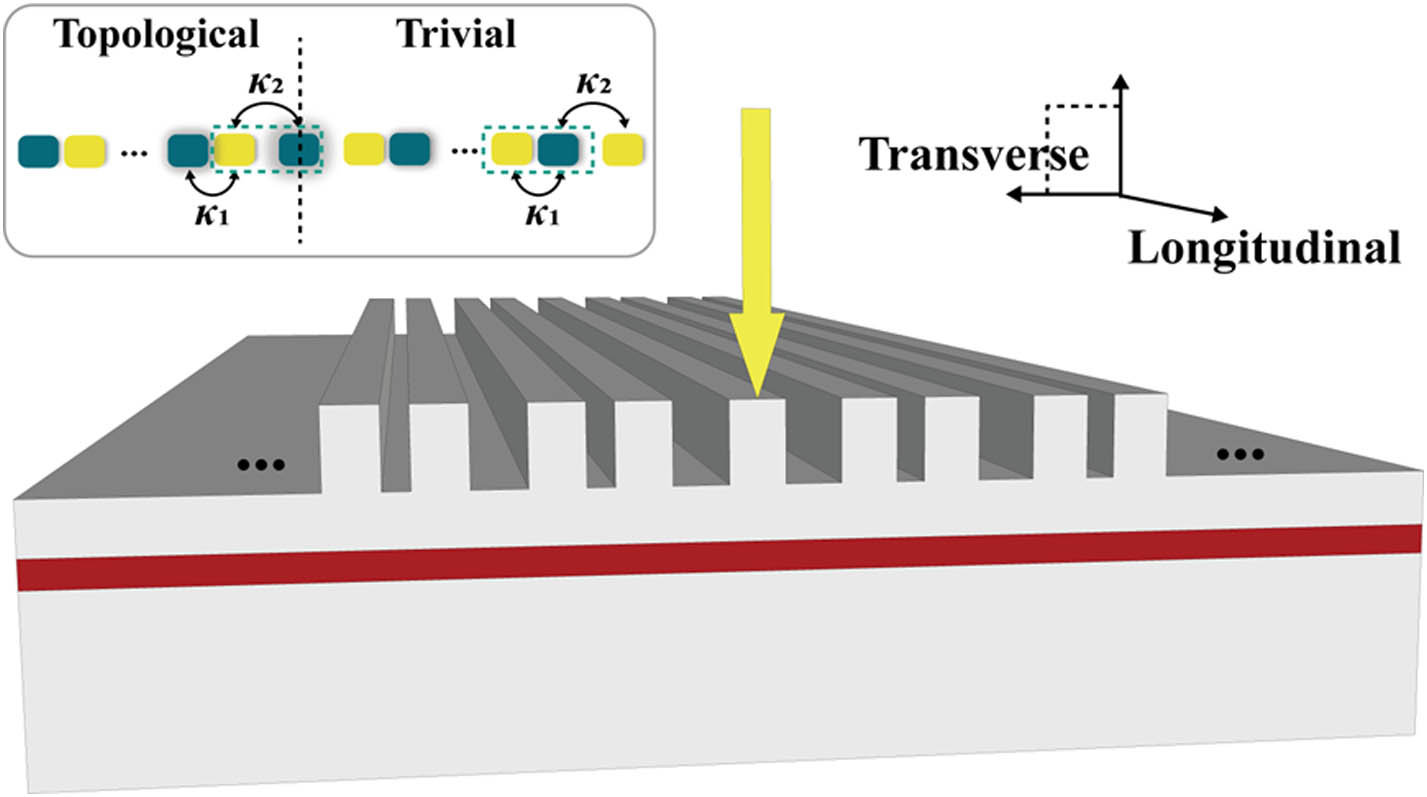
    Fig. 1. Schematic of the topological semiconductor laser array based on the traditional SSH model with a single defect. The yellow arrow denotes current injection on the single-defect waveguide, and the red part is the active region. The inset presents a sketch of the traditional 1D SSH dimer chain, where the green dashed squares indicate primitive cells in two distinct topological phases. In the topological chain, inter-cell coupling is stronger than intra-cell coupling, while intra-cell coupling is stronger in the trivial chain. A zero-energy topological state emerges at the interface indicated by the black dashed line.
    Mode dispersions in the (a) topological laser array and (b) perturbed topological laser array based on the traditional SSH model. The inset in (b) presents the intensity distribution of the zero-energy topological state in the perturbed topological laser array (circled in red). Complex mode dispersions in the (c) topological laser array and (d) perturbed topological laser array based on the traditional SSH model, with a loss term γ introduced into the Hamiltonian.
    Fig. 2. Mode dispersions in the (a) topological laser array and (b) perturbed topological laser array based on the traditional SSH model. The inset in (b) presents the intensity distribution of the zero-energy topological state in the perturbed topological laser array (circled in red). Complex mode dispersions in the (c) topological laser array and (d) perturbed topological laser array based on the traditional SSH model, with a loss term γ introduced into the Hamiltonian.
    Microscope images of parts of fabricated laser arrays from top view. (a) Top-view image of the topological laser array. (b) Top-view image of the perturbed topological laser array; dashed square denotes the introduced perturbations. Only the neighboring distances between the encircled four waveguides are changed. The injection windows are introduced at the central ridge waveguides (denoted by yellow arrows).
    Fig. 3. Microscope images of parts of fabricated laser arrays from top view. (a) Top-view image of the topological laser array. (b) Top-view image of the perturbed topological laser array; dashed square denotes the introduced perturbations. Only the neighboring distances between the encircled four waveguides are changed. The injection windows are introduced at the central ridge waveguides (denoted by yellow arrows).
    LI curves and spectra of the fabricated topological laser array and perturbed topological laser array. Thresholds (Tth) of two laser arrays are both around 30 mA, which can be seen in (a). (b), (c) Spectra of the topological laser array at 45 mA and 60 mA, respectively. (d), (e) Spectra of the perturbed topological laser array at 45 mA and 60 mA, respectively.
    Fig. 4. LI curves and spectra of the fabricated topological laser array and perturbed topological laser array. Thresholds (Tth) of two laser arrays are both around 30 mA, which can be seen in (a). (b), (c) Spectra of the topological laser array at 45 mA and 60 mA, respectively. (d), (e) Spectra of the perturbed topological laser array at 45 mA and 60 mA, respectively.
    (a) Mode dispersions of three-defect waveguides (left) and side arrays (right). (b) Mode dispersion of the proposed three-defect laser array that holds the zero-energy state with enlarged mode volume. The intensity distribution of the zero-energy topological state with enlarged mode volume (circled in red) is shown in the inset in the right corner. A schematic of the proposed laser array is plotted in the left corner, where the yellow arrows denote current injections introduced to three-defect waveguides. (c) Complex mode dispersion of the three-defect laser array with a loss term γ introduced into the Hamiltonian.
    Fig. 5. (a) Mode dispersions of three-defect waveguides (left) and side arrays (right). (b) Mode dispersion of the proposed three-defect laser array that holds the zero-energy state with enlarged mode volume. The intensity distribution of the zero-energy topological state with enlarged mode volume (circled in red) is shown in the inset in the right corner. A schematic of the proposed laser array is plotted in the left corner, where the yellow arrows denote current injections introduced to three-defect waveguides. (c) Complex mode dispersion of the three-defect laser array with a loss term γ introduced into the Hamiltonian.
    (a), (b) Spectra of the proposed three-defect topological laser array. (c), (d) Spectra of the normal laser array. (a), (c) Measured at 75 mA, which is equal to 1.5×Ith. (b), (d) Measured at 100 mA, which is equal to 2.0×Ith. The insets in (b) and (d) show the magnified spectra around the main peaks indicated by dashed squares.
    Fig. 6. (a), (b) Spectra of the proposed three-defect topological laser array. (c), (d) Spectra of the normal laser array. (a), (c) Measured at 75 mA, which is equal to 1.5×Ith. (b), (d) Measured at 100 mA, which is equal to 2.0×Ith. The insets in (b) and (d) show the magnified spectra around the main peaks indicated by dashed squares.
    Horizontal far-field distribution of the (a) traditional single-defect topological laser array and (b) three-defect topological laser array at I=2.0×Ith. The insets are near-field patterns of the corresponding laser arrays at I=1.5×Ith.
    Fig. 7. Horizontal far-field distribution of the (a) traditional single-defect topological laser array and (b) three-defect topological laser array at I=2.0×Ith. The insets are near-field patterns of the corresponding laser arrays at I=1.5×Ith.
    Jingxuan Chen, Mingjin Wang, Ting Fu, Yufei Wang, Xueyou Wang, Yingqiu Dai, Ziyuan Liao, Haiyang Ji, Wanhua Zheng. Improvement on the topological localized interface enabled by chiral symmetry[J]. Photonics Research, 2023, 11(9): 1517
    Download Citation