Author Affiliations
1Ecole Polytechnique Fédérale de Lausanne (EPFL), Photonic Systems Laboratory (PHOSL), STI-IEL, Station 11, CH-1015 Lausanne, Switzerland2Ecole Polytechnique Fédérale de Lausanne (EPFL), Laboratory of Photonics and Quantum Measurements (LPQM), SB-IPHYS, Station 3, CH-1015 Lausanne, Switzerlandshow less
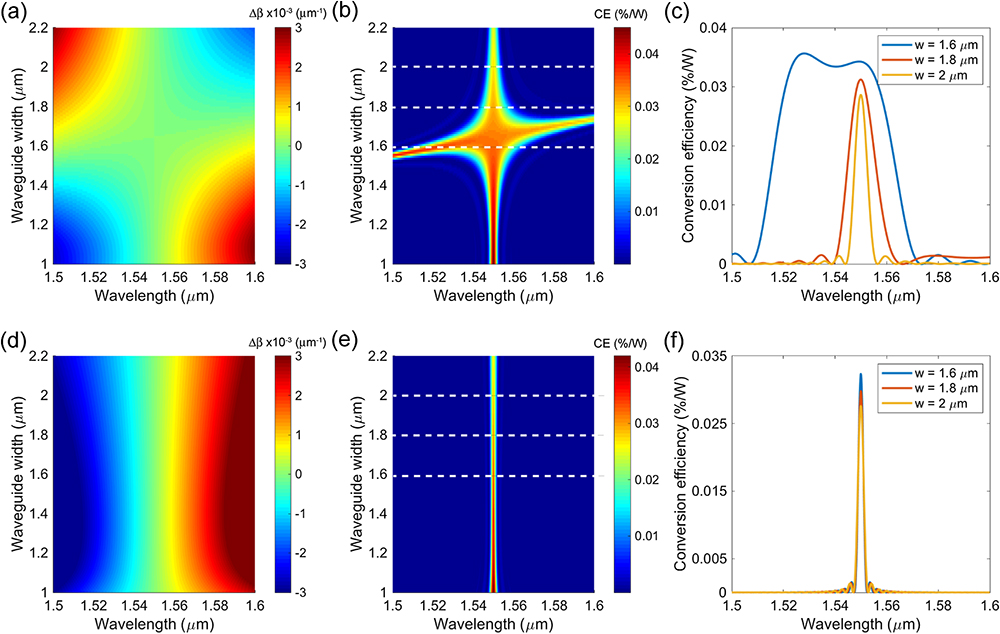
Fig. 1. (a) and (d) Propagation constant mismatch Δβ. (b) and (e) CE dependence on wavelength and waveguide width in 0.75 μm thick Si3N4 waveguide all-optically poled at 1.55 μm. (c) and (f) CE as a function of wavelength along the dashed lines in (b) and (e), respectively. Top and bottom rows consider TE- and TM-polarized light, respectively. Grating length Lg is 10 mm and χeff(2) is 0.1 pm/V.
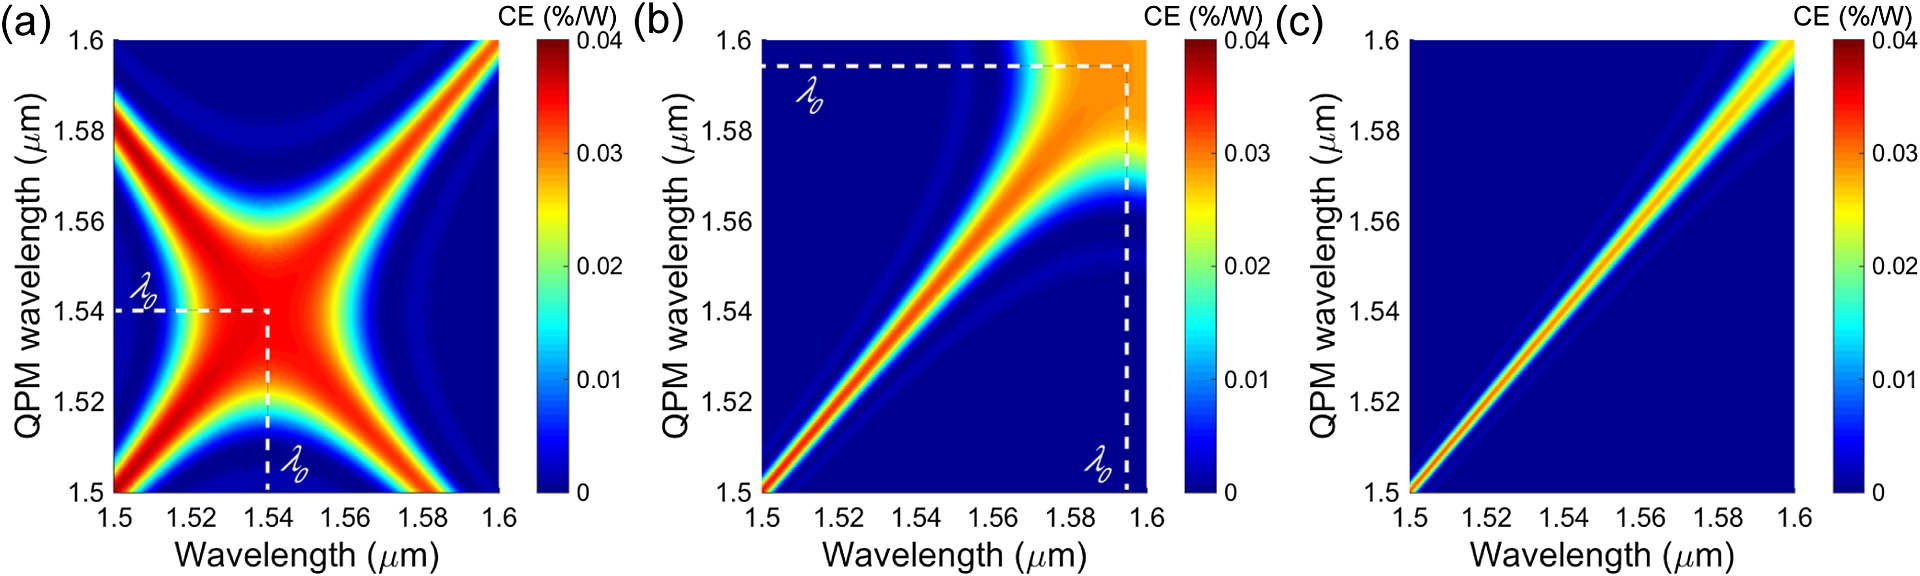
Fig. 2. CE dependence on wavelength in waveguides having different QPM wavelengths. The waveguide height is 0.75 μm and widths are (a) 1.6 μm, (b) 1.8 μm, and (c) 2.0 μm. The plots consider TE polarized light; the grating length Lg is 10 mm and χeff(2) is 0.1 pm/V. λ0 indicates the wavelength at which condition by Eq. (3) is satisfied.
Fig. 3. Experimentally measured CE spectra (blue dots) with fits (red dashed line) of waveguides all-optically poled at 1.55 μm with the effective nonlinearity χeff(2), grating length Lg, and period Λ obtained from fit. Waveguide cross-sections are (a) and (d) 1.6 μm×0.75 μm, (b) and (e) 1.8 μm×0.75 μm, and (c) and (f) 2.0 μm×0.75 μm. The polarization is TE for (a)–(c) and TM for (d)–(f) where both polarizations in the waveguides with the same dimensions result in independent parameter sets.
Fig. 4. Carrier-envelope-offset frequency measurement employing an all-optically poled Si3N4 waveguide. (a) Spectra of SC generated in a 2.65 μm×0.78 μm dispersion-engineered waveguide and SH of femtosecond pulses in all-optically poled 1.6 μm×0.75 μm waveguide measured by an optical spectrum analyzer (Yokogawa AQ6374). (b) Measured beat notes between SC and SH. The resolution bandwidth of frequency analyzer (Rohde & Schwarz FSUP Signal Source Analyzer) is 50 kHz.
Fig. 5. (a) ∂(Δβ)/∂λ as a function of waveguide width in a 0.75 μm thick Si3N4 waveguide all-optically poled at 1.55 μm. When the ∂(Δβ)/∂λ is positive in the waveguide around poling wavelength, the QPM wavelength will blueshift with the increase of temperature, and vice versa. (b) and (c) Measurements (points) and fits (lines) of CE spectra at different temperatures in poled 1.8 μm×0.75 μm waveguide for operation using TE or TM polarized light, respectively. (d) Extracted QPM wavelength as well as temperature dependence and linear fits. Tuning slopes Δλ/ΔT calculated from linear fits are 691±38 pm/K and −237±12 pm/K for TE and TM polarized light, respectively.
Fig. 6. (a) Group index ngω of TE-polarized light as a function of wavelength calculated at different Si3N4 waveguide widths and fixed waveguide height of 0.75 μm. (b) Difference between group indexes Δng at 0.78 and 1.56 μm as a function of Si3N4 waveguide width having height of 0.75 μm.
Fig. 7. Setup for femtosecond laser fCEO retrieval. S is the femtosecond light source (FemtoFErb 1560 from Toptica); λ/2, half-wave plate for polarization control; BS, beam splitter; M, gold coated mirror; F, a set of dichroic filters transmitting between 0.6 and 0.95 μm; DL, delay line; D, detecting unit, including fiber coupler, single-mode fiber, high-speed detector (FPD610-FC-VIS from Menlo Systems), and frequency analyzer. SH and DW stand for second harmonic and dispersive wave, respectively.
Fig. 8. (a) Calculated integrated dispersion βint for waveguide with cross-section 2.65 μm×0.78 μmSi3N4 waveguide. (b) Numerically calculated SC generated in a waveguide with cross-section 2.65 μm×0.78 μm and (c) measured SC spectrum at the output of a 5 mm long straight waveguide with 15 dBm average power in the waveguide.
Fig. 9. Propagation constant mismatch Δβ as a function of wavelength. If Δβ decreases with wavelength, then temperature change from T1 to T2, where T2>T1, will cause the QPM wavelength to redshift or ΔλQPM>0. The opposite happens if Δβ increases with wavelength.